Data
457,927 items of data are available, covering 210,739 participants.
Defined-instances run from 0 to 4, labelled using Instancing
1.
Units of measurement are g.
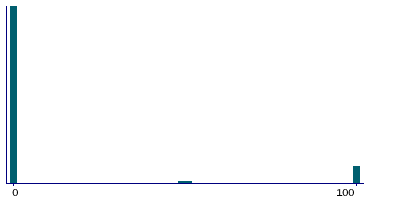
| Maximum | 400 |
| Decile 9 | 50 |
| Decile 8 | 0 |
| Decile 7 | 0 |
| Decile 6 | 0 |
| Median | 0 |
| Decile 4 | 0 |
| Decile 3 | 0 |
| Decile 2 | 0 |
| Decile 1 | 0 |
| Minimum | 0 |
|

|
- Mean = 11.5372
- Std.dev = 34.108
- 3780 items above graph maximum of 100
|
5 Instances
Instance 0 : Conducted in assessment centre, April 2009 to September 2010.
70,630 participants, 70,630 items
| Maximum | 400 |
| Decile 9 | 50 |
| Decile 8 | 0 |
| Decile 7 | 0 |
| Decile 6 | 0 |
| Median | 0 |
| Decile 4 | 0 |
| Decile 3 | 0 |
| Decile 2 | 0 |
| Decile 1 | 0 |
| Minimum | 0 |
|
|
- Mean = 10.9203
- Std.dev = 33.6145
- 564 items above graph maximum of 100
|
Instance 1 : On-line cycle 1, February 2011 to April 2011.
100,447 participants, 100,447 items
| Maximum | 400 |
| Decile 9 | 50 |
| Decile 8 | 0 |
| Decile 7 | 0 |
| Decile 6 | 0 |
| Median | 0 |
| Decile 4 | 0 |
| Decile 3 | 0 |
| Decile 2 | 0 |
| Decile 1 | 0 |
| Minimum | 0 |
|

|
- Mean = 11.2208
- Std.dev = 33.521
- 769 items above graph maximum of 100
|
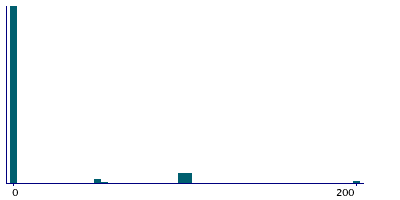
Instance 2 : On-line cycle 2, June 2011 to September 2011.
83,140 participants, 83,140 items
| Maximum | 400 |
| Decile 9 | 100 |
| Decile 8 | 0 |
| Decile 7 | 0 |
| Decile 6 | 0 |
| Median | 0 |
| Decile 4 | 0 |
| Decile 3 | 0 |
| Decile 2 | 0 |
| Decile 1 | 0 |
| Minimum | 0 |
|

|
- Mean = 12.3605
- Std.dev = 35.487
- 69 items above graph maximum of 200
|
Instance 3 : On-line cycle 3, October 2011 to December 2011.
103,616 participants, 103,616 items
| Maximum | 400 |
| Decile 9 | 50 |
| Decile 8 | 0 |
| Decile 7 | 0 |
| Decile 6 | 0 |
| Median | 0 |
| Decile 4 | 0 |
| Decile 3 | 0 |
| Decile 2 | 0 |
| Decile 1 | 0 |
| Minimum | 0 |
|

|
- Mean = 10.385
- Std.dev = 32.1572
- 695 items above graph maximum of 100
|
Instance 4 : On-line cycle 4, April 2012 to June 2012.
100,094 participants, 100,094 items
| Maximum | 400 |
| Decile 9 | 100 |
| Decile 8 | 0 |
| Decile 7 | 0 |
| Decile 6 | 0 |
| Median | 0 |
| Decile 4 | 0 |
| Decile 3 | 0 |
| Decile 2 | 0 |
| Decile 1 | 0 |
| Minimum | 0 |
|
|
- Mean = 12.799
- Std.dev = 35.7349
- 54 items above graph maximum of 200
|
