Data
457,927 items of data are available, covering 210,739 participants.
Defined-instances run from 0 to 4, labelled using Instancing
1.
Units of measurement are g.
| Maximum | 295 |
| Decile 9 | 50 |
| Decile 8 | 30 |
| Decile 7 | 15 |
| Decile 6 | 0 |
| Median | 0 |
| Decile 4 | 0 |
| Decile 3 | 0 |
| Decile 2 | 0 |
| Decile 1 | 0 |
| Minimum | 0 |
|

|
- Mean = 13.2939
- Std.dev = 22.9097
- 2616 items above graph maximum of 100
|
5 Instances
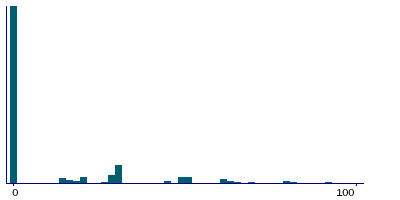
Instance 0 : Conducted in assessment centre, April 2009 to September 2010.
70,630 participants, 70,630 items
| Maximum | 275 |
| Decile 9 | 50 |
| Decile 8 | 30 |
| Decile 7 | 0 |
| Decile 6 | 0 |
| Median | 0 |
| Decile 4 | 0 |
| Decile 3 | 0 |
| Decile 2 | 0 |
| Decile 1 | 0 |
| Minimum | 0 |
|
|
- Mean = 11.4302
- Std.dev = 21.4245
- 334 items above graph maximum of 100
|
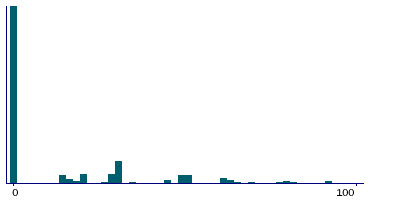
Instance 1 : On-line cycle 1, February 2011 to April 2011.
100,447 participants, 100,447 items
| Maximum | 275 |
| Decile 9 | 50 |
| Decile 8 | 30 |
| Decile 7 | 20 |
| Decile 6 | 0 |
| Median | 0 |
| Decile 4 | 0 |
| Decile 3 | 0 |
| Decile 2 | 0 |
| Decile 1 | 0 |
| Minimum | 0 |
|

|
- Mean = 13.9181
- Std.dev = 23.5347
- 649 items above graph maximum of 100
|
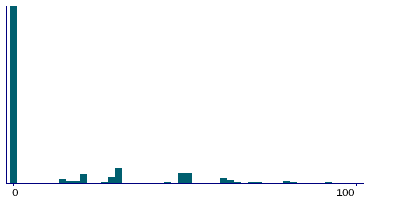
Instance 2 : On-line cycle 2, June 2011 to September 2011.
83,140 participants, 83,140 items
| Maximum | 275 |
| Decile 9 | 50 |
| Decile 8 | 30 |
| Decile 7 | 20 |
| Decile 6 | 0 |
| Median | 0 |
| Decile 4 | 0 |
| Decile 3 | 0 |
| Decile 2 | 0 |
| Decile 1 | 0 |
| Minimum | 0 |
|
|
- Mean = 13.7032
- Std.dev = 22.6841
- 432 items above graph maximum of 100
|
Instance 3 : On-line cycle 3, October 2011 to December 2011.
103,616 participants, 103,616 items
| Maximum | 295 |
| Decile 9 | 50 |
| Decile 8 | 30 |
| Decile 7 | 15 |
| Decile 6 | 0 |
| Median | 0 |
| Decile 4 | 0 |
| Decile 3 | 0 |
| Decile 2 | 0 |
| Decile 1 | 0 |
| Minimum | 0 |
|
|
- Mean = 13.3829
- Std.dev = 23.5258
- 679 items above graph maximum of 100
|
Instance 4 : On-line cycle 4, April 2012 to June 2012.
100,094 participants, 100,094 items
| Maximum | 275 |
| Decile 9 | 50 |
| Decile 8 | 30 |
| Decile 7 | 15 |
| Decile 6 | 0 |
| Median | 0 |
| Decile 4 | 0 |
| Decile 3 | 0 |
| Decile 2 | 0 |
| Decile 1 | 0 |
| Minimum | 0 |
|

|
- Mean = 13.5504
- Std.dev = 22.7608
- 522 items above graph maximum of 100
|
