Data
502,881 items of data are available, covering 478,814 participants.
Defined-instances run from 0 to 2, labelled using Instancing
2.
Units of measurement are percent.
| Maximum | 38.96 |
| Decile 9 | 14.49 |
| Decile 8 | 14 |
| Decile 7 | 13.73 |
| Decile 6 | 13.51 |
| Median | 13.34 |
| Decile 4 | 13.18 |
| Decile 3 | 13 |
| Decile 2 | 12.8 |
| Decile 1 | 12.57 |
| Minimum | 2.28 |
|

|
- Mean = 13.4939
- Std.dev = 0.984218
- 2 items below graph minimum of 10.65
- 7900 items above graph maximum of 16.41
|
3 Instances
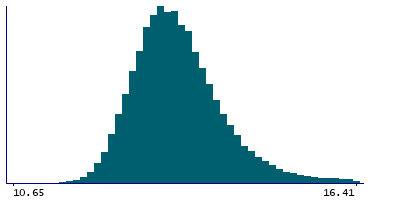
Instance 0 : Initial assessment visit (2006-2010) at which participants were recruited and consent given
477,636 participants, 477,636 items
| Maximum | 38.96 |
| Decile 9 | 14.49 |
| Decile 8 | 14 |
| Decile 7 | 13.73 |
| Decile 6 | 13.51 |
| Median | 13.34 |
| Decile 4 | 13.18 |
| Decile 3 | 13 |
| Decile 2 | 12.8 |
| Decile 1 | 12.57 |
| Minimum | 2.28 |
|
|
- Mean = 13.4933
- Std.dev = 0.987508
- 2 items below graph minimum of 10.65
- 7560 items above graph maximum of 16.41
|
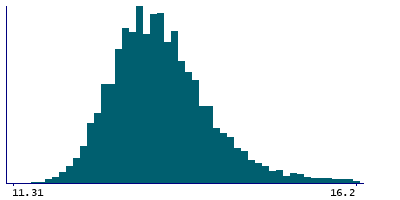
Instance 1 : First repeat assessment visit (2012-13)
19,390 participants, 19,390 items
| Maximum | 31.7 |
| Decile 9 | 14.4 |
| Decile 8 | 14 |
| Decile 7 | 13.7 |
| Decile 6 | 13.5 |
| Median | 13.37 |
| Decile 4 | 13.2 |
| Decile 3 | 13 |
| Decile 2 | 12.82 |
| Decile 1 | 12.6 |
| Minimum | 11.31 |
|
|
- Mean = 13.4812
- Std.dev = 0.903798
- 289 items above graph maximum of 16.2
|
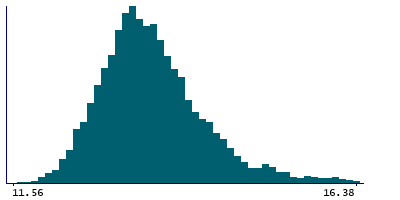
Instance 2 : Imaging visit (2014+)
5,855 participants, 5,855 items
| Maximum | 27.09 |
| Decile 9 | 14.53 |
| Decile 8 | 14.08 |
| Decile 7 | 13.8 |
| Decile 6 | 13.6 |
| Median | 13.43 |
| Decile 4 | 13.27 |
| Decile 3 | 13.11 |
| Decile 2 | 12.93 |
| Decile 1 | 12.68 |
| Minimum | 11.56 |
|
|
- Mean = 13.5826
- Std.dev = 0.96635
- 97 items above graph maximum of 16.38
|
Notes
Result of "Red Distribution Width" assay, performed on blood sample, obtained from UK Biobank assessment centre visit. Red blood cell Distribution Width is the size distribution spread of the erythrocyte population derived from the red blood cell histogram. It is the coefficient of variation (CV) expressed in % of the red blood cell size distribution.
4 Related Data-Fields
| Field ID | Description | Relationship |
|---|
| 30074 | Red blood cell (erythrocyte) distrib ... | Field 30074 is the data route used to acquire the result in Current Field |
| 30072 | Red blood cell (erythrocyte) distrib ... | Field 30072 is the original acquisition time of the sample generating the result in Current Field. |
| 30073 | Red blood cell (erythrocyte) distrib ... | Field 30073 is the ID of the device user to generate the result in Current Field |
| 30071 | Red blood cell (erythrocyte) distrib ... | Field 30071 is the number of freeze-thaw cycles a sample underwent before generating the result in Current Field. |
1 Application
| Application ID | Title |
|---|
| 45925 | Risk Factors, Biomarkers and Impact of Major Vision-Threatening Eye Diseases |

