Data
497,212 items of data are available, covering 478,597 participants.
Defined-instances run from 0 to 2, labelled using Instancing
2.
Units of measurement are percent.
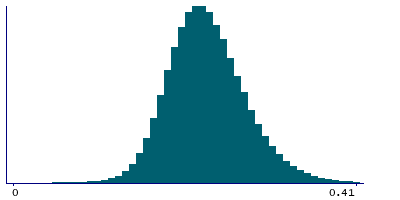
| Maximum | 1.445 |
| Decile 9 | 0.293 |
| Decile 8 | 0.269 |
| Decile 7 | 0.253 |
| Decile 6 | 0.24 |
| Median | 0.228 |
| Decile 4 | 0.217 |
| Decile 3 | 0.206 |
| Decile 2 | 0.193 |
| Decile 1 | 0.176 |
| Minimum | 0 |
|
|
- Mean = 0.231811
- Std.dev = 0.0490678
- 1520 items above graph maximum of 0.41
|
3 Instances
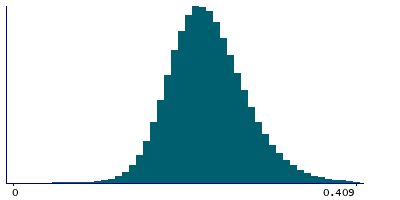
Instance 0 : Initial assessment visit (2006-2010) at which participants were recruited and consent given
477,631 participants, 477,631 items
| Maximum | 1.445 |
| Decile 9 | 0.293 |
| Decile 8 | 0.269 |
| Decile 7 | 0.253 |
| Decile 6 | 0.241 |
| Median | 0.229 |
| Decile 4 | 0.218 |
| Decile 3 | 0.207 |
| Decile 2 | 0.194 |
| Decile 1 | 0.177 |
| Minimum | 0 |
|
|
- Mean = 0.232726
- Std.dev = 0.0490142
- 1565 items above graph maximum of 0.409
|
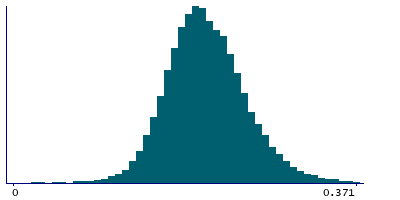
Instance 1 : First repeat assessment visit (2012-13)
13,726 participants, 13,726 items
| Maximum | 0.586 |
| Decile 9 | 0.264 |
| Decile 8 | 0.243 |
| Decile 7 | 0.229 |
| Decile 6 | 0.217 |
| Median | 0.206 |
| Decile 4 | 0.196 |
| Decile 3 | 0.185 |
| Decile 2 | 0.174 |
| Decile 1 | 0.157 |
| Minimum | 0.012 |
|
|
- Mean = 0.209062
- Std.dev = 0.0448412
- 40 items above graph maximum of 0.371
|
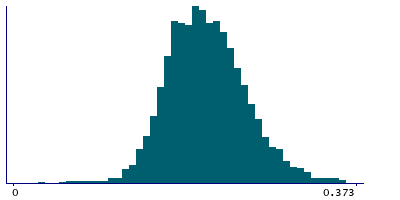
Instance 2 : Imaging visit (2014+)
5,855 participants, 5,855 items
| Maximum | 0.788 |
| Decile 9 | 0.266 |
| Decile 8 | 0.245 |
| Decile 7 | 0.23 |
| Decile 6 | 0.219 |
| Median | 0.207 |
| Decile 4 | 0.197 |
| Decile 3 | 0.185 |
| Decile 2 | 0.174 |
| Decile 1 | 0.159 |
| Minimum | 0.019 |
|
|
- Mean = 0.210459
- Std.dev = 0.0450472
- 15 items above graph maximum of 0.373
|
Notes
Result of "Platelet Crit" assay, performed on blood sample, obtained from UK Biobank assessment centre visit. Platelet Crit is a computed value that represents the platelet packed cell volume.
4 Related Data-Fields
| Field ID | Description | Relationship |
|---|
| 30094 | Platelet crit acquisition route | Field 30094 is the data route used to acquire the result in Current Field |
| 30092 | Platelet crit acquisition time | Field 30092 is the original acquisition time of the sample generating the result in Current Field. |
| 30093 | Platelet crit device ID | Field 30093 is the ID of the device user to generate the result in Current Field |
| 30091 | Platelet crit freeze-thaw cycles | Field 30091 is the number of freeze-thaw cycles a sample underwent before generating the result in Current Field. |
1 Application
| Application ID | Title |
|---|
| 45925 | Risk Factors, Biomarkers and Impact of Major Vision-Threatening Eye Diseases |

