Data
501,976 items of data are available, covering 477,948 participants.
Defined-instances run from 0 to 2, labelled using Instancing
2.
Units of measurement are 10^9 cells/Litre.
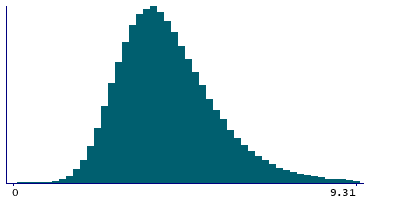
| Maximum | 76.42 |
| Decile 9 | 6 |
| Decile 8 | 5.22 |
| Decile 7 | 4.73 |
| Decile 6 | 4.36 |
| Median | 4.02 |
| Decile 4 | 3.71 |
| Decile 3 | 3.41 |
| Decile 2 | 3.1 |
| Decile 1 | 2.69 |
| Minimum | 0 |
|
|
- Mean = 4.22966
- Std.dev = 1.4209
- 2854 items above graph maximum of 9.31
|
3 Instances
Instance 0 : Initial assessment visit (2006-2010) at which participants were recruited and consent given
476,750 participants, 476,750 items
| Maximum | 76.42 |
| Decile 9 | 6 |
| Decile 8 | 5.22 |
| Decile 7 | 4.73 |
| Decile 6 | 4.36 |
| Median | 4.02 |
| Decile 4 | 3.71 |
| Decile 3 | 3.4 |
| Decile 2 | 3.1 |
| Decile 1 | 2.68 |
| Minimum | 0 |
|

|
- Mean = 4.22796
- Std.dev = 1.42168
- 2680 items above graph maximum of 9.32
|
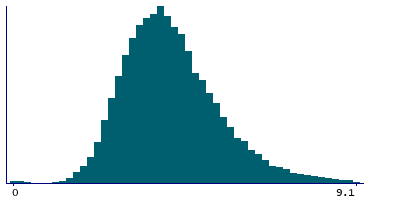
Instance 1 : First repeat assessment visit (2012-13)
19,378 participants, 19,378 items
| Maximum | 29.7 |
| Decile 9 | 5.9 |
| Decile 8 | 5.2 |
| Decile 7 | 4.7 |
| Decile 6 | 4.39 |
| Median | 4.03 |
| Decile 4 | 3.76 |
| Decile 3 | 3.48 |
| Decile 2 | 3.1 |
| Decile 1 | 2.7 |
| Minimum | 0 |
|
|
- Mean = 4.22943
- Std.dev = 1.38287
- 114 items above graph maximum of 9.1
|
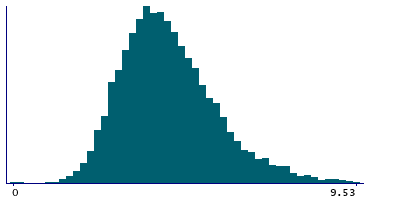
Instance 2 : Imaging visit (2014+)
5,848 participants, 5,848 items
| Maximum | 20.83 |
| Decile 9 | 6.155 |
| Decile 8 | 5.38 |
| Decile 7 | 4.885 |
| Decile 6 | 4.5 |
| Median | 4.16 |
| Decile 4 | 3.85 |
| Decile 3 | 3.55 |
| Decile 2 | 3.21 |
| Decile 1 | 2.77 |
| Minimum | 0 |
|
|
- Mean = 4.36896
- Std.dev = 1.47388
- 49 items above graph maximum of 9.54
|
Notes
Result of "Neutrophils Number" assay, performed on blood sample, obtained from UK Biobank assessment centre visit. Neutrophils count is the proportion of ( neutrophils / 100 ) x white blood cell count.
4 Related Data-Fields
| Field ID | Description | Relationship |
|---|
| 30144 | Neutrophill count acquisition route | Field 30144 is the data route used to acquire the result in Current Field |
| 30142 | Neutrophill count acquisition time | Field 30142 is the original acquisition time of the sample generating the result in Current Field. |
| 30143 | Neutrophill count device ID | Field 30143 is the ID of the device user to generate the result in Current Field |
| 30141 | Neutrophill count freeze-thaw cycles | Field 30141 is the number of freeze-thaw cycles a sample underwent before generating the result in Current Field. |
1 Application
| Application ID | Title |
|---|
| 45925 | Risk Factors, Biomarkers and Impact of Major Vision-Threatening Eye Diseases |

