Data
485,213 items of data are available, covering 485,213 participants.
Defined-instances run from 0 to 2, labelled using Instancing
2.
Units of measurement are ng/micro-l.
| Maximum | 572.24 |
| Decile 9 | 20.03 |
| Decile 8 | 15.4 |
| Decile 7 | 14.5 |
| Decile 6 | 13.94 |
| Median | 13.48 |
| Decile 4 | 13 |
| Decile 3 | 12.58 |
| Decile 2 | 12 |
| Decile 1 | 11.2 |
| Minimum | 0 |
|

|
- Mean = 15.2139
- Std.dev = 7.20312
- 36256 items above graph maximum of 28.86
|
3 Instances
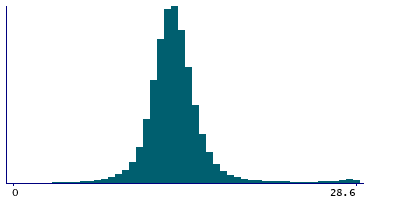
Instance 0 : Initial assessment visit (2006-2010) at which participants were recruited and consent given
483,830 participants, 483,830 items
| Maximum | 572.24 |
| Decile 9 | 19.9 |
| Decile 8 | 15.4 |
| Decile 7 | 14.5 |
| Decile 6 | 13.94 |
| Median | 13.48 |
| Decile 4 | 13 |
| Decile 3 | 12.58 |
| Decile 2 | 12 |
| Decile 1 | 11.2 |
| Minimum | 0 |
|
|
- Mean = 15.2031
- Std.dev = 7.17445
- 36970 items above graph maximum of 28.6
|
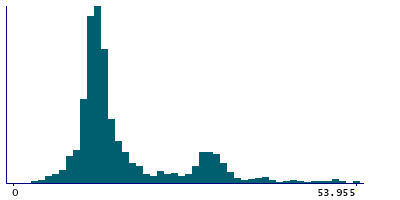
Instance 1 : First repeat assessment visit (2012-13)
1,341 participants, 1,341 items
| Maximum | 154.03 |
| Decile 9 | 32.41 |
| Decile 8 | 27.58 |
| Decile 7 | 17.68 |
| Decile 6 | 14.94 |
| Median | 14 |
| Decile 4 | 13.205 |
| Decile 3 | 12.6 |
| Decile 2 | 11.995 |
| Decile 1 | 10.885 |
| Minimum | 2.9 |
|
|
- Mean = 19.0562
- Std.dev = 13.5433
- 34 items above graph maximum of 53.935
|
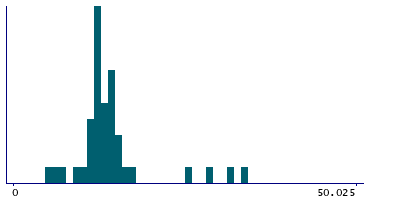
Instance 2 : Imaging visit (2014+)
42 participants, 42 items
| Maximum | 60.16 |
| Decile 9 | 30.37 |
| Decile 8 | 15.6 |
| Decile 7 | 14.43 |
| Decile 6 | 13.885 |
| Median | 13.13 |
| Decile 4 | 12.43 |
| Decile 3 | 12.19 |
| Decile 2 | 11.84 |
| Decile 1 | 10.715 |
| Minimum | 4.8 |
|
|
- Mean = 16.3869
- Std.dev = 11.2482
- 2 items above graph maximum of 50.025
|
Notes
Sample concentration of normalised sample as measured by UKB.
0 Related Data-Fields
There are no related data-fields
0 Resources
There are no matching Resources
