Data
238,213 items of data are available, covering 233,281 participants.
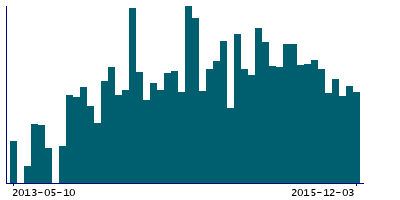
Defined-instances run from 0 to 1, labelled using Instancing
93.
| Maximum | 2018-04-03 |
| Decile 9 | 2015-09-24 |
| Decile 8 | 2015-07-02 |
| Decile 7 | 2015-04-16 |
| Decile 6 | 2015-01-30 |
| Median | 2014-11-14 |
| Decile 4 | 2014-08-29 |
| Decile 3 | 2014-05-30 |
| Decile 2 | 2014-03-21 |
| Decile 1 | 2013-11-26 |
| Minimum | 2013-05-10 |
|
|
- There are 145 distinct values.
- Mean = 2014-11-18
- 5063 items above graph maximum of 2017-07-22
|
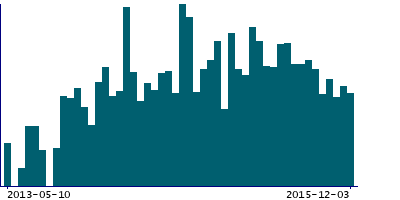
2 Instances
Instance 0 : Main study
233,150 participants, 233,150 items
| Maximum | 2015-12-03 |
| Decile 9 | 2015-09-03 |
| Decile 8 | 2015-06-18 |
| Decile 7 | 2015-04-02 |
| Decile 6 | 2015-01-23 |
| Median | 2014-11-07 |
| Decile 4 | 2014-08-29 |
| Decile 3 | 2014-05-30 |
| Decile 2 | 2014-03-06 |
| Decile 1 | 2013-11-18 |
| Minimum | 2013-05-10 |
|
|
- There are 111 distinct values.
- Mean = 2014-10-24
|
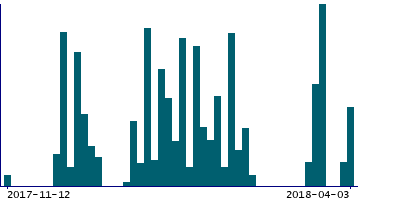
Instance 1 : Seasonal repeat 1
5,063 participants, 5,063 items
| Maximum | 2018-04-03 |
| Decile 9 | 2018-03-22 |
| Decile 8 | 2018-02-19 |
| Decile 7 | 2018-02-12 |
| Decile 6 | 2018-01-31 |
| Median | 2018-01-23 |
| Decile 4 | 2018-01-16 |
| Decile 3 | 2018-01-09 |
| Decile 2 | 2017-12-18 |
| Decile 1 | 2017-12-11 |
| Minimum | 2017-11-12 |
|
|
- There are 34 distinct values.
- Mean = 2018-01-25
|
Notes
Date of invitation to the main physical activity study (Instance 0) and the seasonal repeat physical activity study (Instance 1). The rate of sending email invitations during the main study was varied dynamically to achieve a target throughput of 200 devices per day.
2 Related Data-Fields
| Field ID | Description | Relationship |
|---|
| 110005 | Invitation to physical activity stud ... | Field 110005 is the response to the invitation (instance 0) sent on Current Field |
| 30018 | Invitation to repeat physical activi ... | Field 30018 is the response to the invitation (instance 1) sent on Current Field |
3 Applications
| Application ID | Title |
|---|
| 11867 | Dissection of the Genetic Susceptibility of Obesity Traits and their Comorbidities |
| 9126 | Extracting Meaningful Health Information from Raw Accelerometer Data in UK Biobank |
| 4483 | Identification of modifiable and non-modifiable correlates of sedentary behaviours and physical activity in adults aged =65 years |


