Data
205,846 items of data are available, covering 88,079 participants.
Defined-instances run from 2 to 3, labelled using Instancing
2.
Array indices run from 0 to 5.
Units of measurement are mmHg.
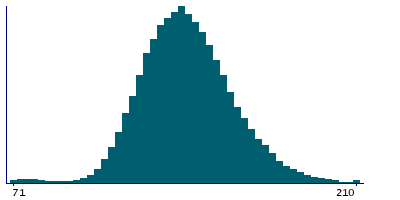
| Maximum | 210 |
| Decile 9 | 166 |
| Decile 8 | 157 |
| Decile 7 | 150 |
| Decile 6 | 145 |
| Median | 141 |
| Decile 4 | 136 |
| Decile 3 | 131 |
| Decile 2 | 126 |
| Decile 1 | 119 |
| Minimum | 8 |
|
|
- There are 201 distinct values.
- Mean = 140.878
- Std.dev = 20.791
- 1997 items below graph minimum of 72
|
2 Instances
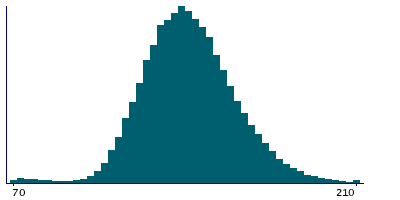
Instance 2 : Imaging visit (2014+)
85,425 participants, 169,049 items
| Maximum | 210 |
| Decile 9 | 166 |
| Decile 8 | 157 |
| Decile 7 | 150 |
| Decile 6 | 145 |
| Median | 141 |
| Decile 4 | 136 |
| Decile 3 | 131 |
| Decile 2 | 126 |
| Decile 1 | 119 |
| Minimum | 8 |
|
|
- There are 201 distinct values.
- Mean = 140.936
- Std.dev = 20.9195
- 1690 items below graph minimum of 72
|
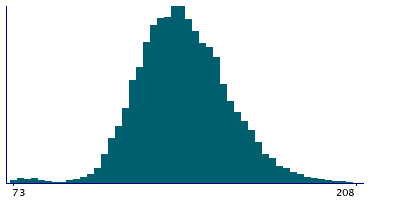
Instance 3 : First repeat imaging visit (2019+)
18,589 participants, 36,797 items
| Maximum | 210 |
| Decile 9 | 165 |
| Decile 8 | 156 |
| Decile 7 | 150 |
| Decile 6 | 145 |
| Median | 140 |
| Decile 4 | 136 |
| Decile 3 | 131 |
| Decile 2 | 126 |
| Decile 1 | 119 |
| Minimum | 11 |
|
|
- There are 186 distinct values.
- Mean = 140.607
- Std.dev = 20.188
- 333 items below graph minimum of 73
|
Notes
Systolic brachial blood pressure during PWA
Note that this field is arrayed to enable representation of the 5 measures of BP acquired during and immediately after the Aortic Distensibility image acquisiton.
0 Related Data-Fields
There are no related data-fields

