Data
196,994 items of data are available, covering 86,484 participants.
Defined-instances run from 2 to 3, labelled using Instancing
2.
Array indices run from 0 to 5.
Units of measurement are litres/min.
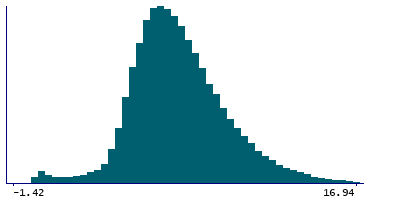
| Maximum | 88.06 |
| Decile 9 | 10.85 |
| Decile 8 | 9.44 |
| Decile 7 | 8.53 |
| Decile 6 | 7.83 |
| Median | 7.23 |
| Decile 4 | 6.67 |
| Decile 3 | 6.13 |
| Decile 2 | 5.54 |
| Decile 1 | 4.76 |
| Minimum | -99 |
|

|
- Mean = 7.50266
- Std.dev = 2.98225
- 36 items below graph minimum of -1.33
- 671 items above graph maximum of 16.94
|
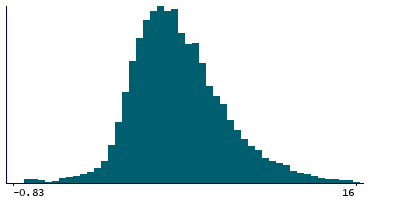
2 Instances
Instance 2 : Imaging visit (2014+)
83,709 participants, 161,387 items
| Maximum | 88.06 |
| Decile 9 | 10.89 |
| Decile 8 | 9.46 |
| Decile 7 | 8.55 |
| Decile 6 | 7.84 |
| Median | 7.23 |
| Decile 4 | 6.67 |
| Decile 3 | 6.12 |
| Decile 2 | 5.53 |
| Decile 1 | 4.74 |
| Minimum | -99 |
|
|
- Mean = 7.50625
- Std.dev = 3.0115
- 30 items below graph minimum of -1.41
- 532 items above graph maximum of 17.04
|
Instance 3 : First repeat imaging visit (2019+)
18,288 participants, 35,607 items
| Maximum | 34.28 |
| Decile 9 | 10.64 |
| Decile 8 | 9.31 |
| Decile 7 | 8.44 |
| Decile 6 | 7.8 |
| Median | 7.22 |
| Decile 4 | 6.7 |
| Decile 3 | 6.18 |
| Decile 2 | 5.61 |
| Decile 1 | 4.86 |
| Minimum | -99 |
|
|
- Mean = 7.48638
- Std.dev = 2.84585
- 6 items below graph minimum of -0.92
- 133 items above graph maximum of 16.42
|
Notes
Cardiac output during PWA
Note that this field is arrayed to enable representation of the 5 measures of BP acquired during and immediately after the Aortic Distensibility image acquisiton.
1 Related Data-Field
| Field ID | Description | Relationship |
|---|
| 12702 | Cardiac index during PWA - PVR | Field 12702 is partly derived from Current Field |

