Data
205,391 items of data are available, covering 87,965 participants.
Defined-instances run from 2 to 3, labelled using Instancing
2.
Array indices run from 0 to 5.
Units of measurement are PRU.
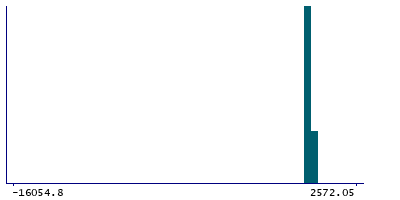
| Maximum | 2572.05 |
| Decile 9 | 1.15 |
| Decile 8 | 1.01 |
| Decile 7 | 0.92 |
| Decile 6 | 0.85 |
| Median | 0.79 |
| Decile 4 | 0.73 |
| Decile 3 | 0.67 |
| Decile 2 | 0.6 |
| Decile 1 | 0.5 |
| Minimum | -1.87662e+07 |
|
|
- Mean = -15075.2
- Std.dev = 332204
- 466 items below graph minimum of -18768.3
- 1 item above graph maximum of 2572.05
|
2 Instances
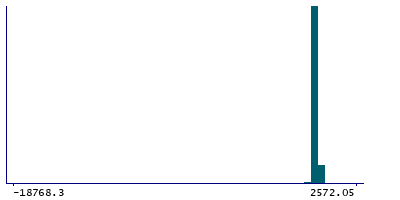
Instance 2 : Imaging visit (2014+)
85,275 participants, 168,658 items
| Maximum | 2572.05 |
| Decile 9 | 1.16 |
| Decile 8 | 1.01 |
| Decile 7 | 0.92 |
| Decile 6 | 0.85 |
| Median | 0.79 |
| Decile 4 | 0.73 |
| Decile 3 | 0.66 |
| Decile 2 | 0.59 |
| Decile 1 | 0.5 |
| Minimum | -1.87662e+07 |
|
|
- Mean = -16126
- Std.dev = 343221
- 412 items below graph minimum of -18768.3
- 1 item above graph maximum of 2572.05
|
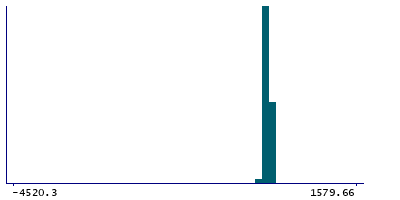
Instance 3 : First repeat imaging visit (2019+)
18,564 participants, 36,733 items
| Maximum | 1869.07 |
| Decile 9 | 1.12 |
| Decile 8 | 0.99 |
| Decile 7 | 0.91 |
| Decile 6 | 0.85 |
| Median | 0.79 |
| Decile 4 | 0.73 |
| Decile 3 | 0.68 |
| Decile 2 | 0.62 |
| Decile 1 | 0.53 |
| Minimum | -9.96737e+06 |
|
|
- Mean = -10250.3
- Std.dev = 275978
- 54 items below graph minimum of -9968.71
- 1 item above graph maximum of 1869.07
|
Notes
Total peripheral resistance during PWA
Note that this field is arrayed to enable representation of the 5 measures of BP acquired during and immediately after the Aortic Distensibility image acquisiton.
0 Related Data-Fields
There are no related data-fields

