Data
205,733 items of data are available, covering 88,069 participants.
Defined-instances run from 2 to 3, labelled using Instancing
2.
Array indices run from 0 to 5.
Units of measurement are mmHg.
| Maximum | 194 |
| Decile 9 | 114 |
| Decile 8 | 108 |
| Decile 7 | 103 |
| Decile 6 | 100 |
| Median | 97 |
| Decile 4 | 94 |
| Decile 3 | 90 |
| Decile 2 | 87 |
| Decile 1 | 81 |
| Minimum | -269 |
|

|
- There are 173 distinct values.
- Mean = 96.8848
- Std.dev = 13.8292
- 1078 items below graph minimum of 48
- 132 items above graph maximum of 147
|
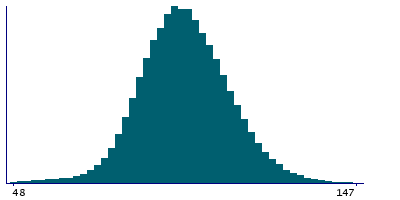
2 Instances
Instance 2 : Imaging visit (2014+)
85,414 participants, 168,955 items
| Maximum | 194 |
| Decile 9 | 114 |
| Decile 8 | 108 |
| Decile 7 | 104 |
| Decile 6 | 100 |
| Median | 97 |
| Decile 4 | 94 |
| Decile 3 | 91 |
| Decile 2 | 87 |
| Decile 1 | 81 |
| Minimum | -269 |
|
|
- There are 171 distinct values.
- Mean = 96.9933
- Std.dev = 13.9557
- 930 items below graph minimum of 48
- 117 items above graph maximum of 147
|
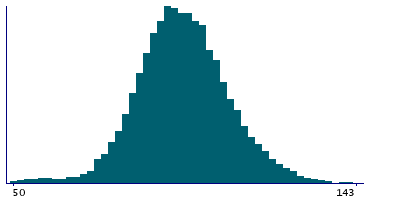
Instance 3 : First repeat imaging visit (2019+)
18,588 participants, 36,778 items
| Maximum | 189 |
| Decile 9 | 112 |
| Decile 8 | 106 |
| Decile 7 | 102 |
| Decile 6 | 99 |
| Median | 96 |
| Decile 4 | 93 |
| Decile 3 | 90 |
| Decile 2 | 87 |
| Decile 1 | 82 |
| Minimum | 11 |
|
|
- There are 139 distinct values.
- Mean = 96.3861
- Std.dev = 13.2211
- 208 items below graph minimum of 52
- 35 items above graph maximum of 142
|
Notes
Mean arterial pressure during PWA. Measured from the area under the aortic waveform.
Note that this field is arrayed to enable representation of the 5 measures of BP acquired during and immediately after the Aortic Distensibility image acquisiton.
0 Related Data-Fields
There are no related data-fields

