Data
104,799 items of data are available, covering 88,639 participants.
Defined-instances run from 2 to 3, labelled using Instancing
2.
Units of measurement are tests.
| Maximum | 6 |
| Decile 9 | 2 |
| Decile 8 | 2 |
| Decile 7 | 2 |
| Decile 6 | 2 |
| Median | 2 |
| Decile 4 | 2 |
| Decile 3 | 2 |
| Decile 2 | 2 |
| Decile 1 | 2 |
| Minimum | 0 |
|

|
- There are 7 distinct values.
- Mean = 1.98838
- Std.dev = 0.24185
- 395 items below graph minimum of 1
- 67 items above graph maximum of 3
|
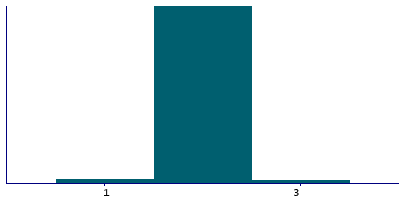
2 Instances
Instance 2 : Imaging visit (2014+)
86,120 participants, 86,120 items
| Maximum | 5 |
| Decile 9 | 2 |
| Decile 8 | 2 |
| Decile 7 | 2 |
| Decile 6 | 2 |
| Median | 2 |
| Decile 4 | 2 |
| Decile 3 | 2 |
| Decile 2 | 2 |
| Decile 1 | 2 |
| Minimum | 0 |
|
|
- There are 6 distinct values.
- Mean = 1.98675
- Std.dev = 0.245581
- 365 items below graph minimum of 1
- 56 items above graph maximum of 3
|
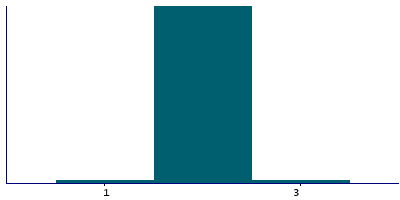
Instance 3 : First repeat imaging visit (2019+)
18,679 participants, 18,679 items
| Maximum | 6 |
| Decile 9 | 2 |
| Decile 8 | 2 |
| Decile 7 | 2 |
| Decile 6 | 2 |
| Median | 2 |
| Decile 4 | 2 |
| Decile 3 | 2 |
| Decile 2 | 2 |
| Decile 1 | 2 |
| Minimum | 0 |
|
|
- There are 7 distinct values.
- Mean = 1.99588
- Std.dev = 0.223694
- 30 items below graph minimum of 1
- 11 items above graph maximum of 3
|
Notes
Number of PWA tests performed during vicorder run.
0 Related Data-Fields
There are no related data-fields

