Data
624,749 items of data are available, covering 501,109 participants.
Defined-instances run from 0 to 3, labelled using Instancing
2.
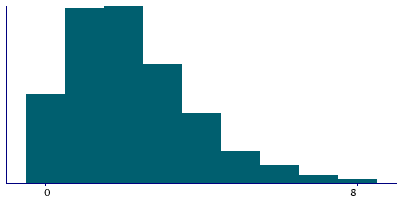
| Maximum | 32 |
| Decile 9 | 4 |
| Decile 8 | 3 |
| Decile 7 | 2 |
| Decile 6 | 2 |
| Median | 2 |
| Decile 4 | 1 |
| Decile 3 | 1 |
| Decile 2 | 0 |
| Decile 1 | 0 |
| Minimum | 0 |
|
|
- There are 22 distinct values.
- Mean = 1.81973
- Std.dev = 1.60119
- 1899 items above graph maximum of 8
|
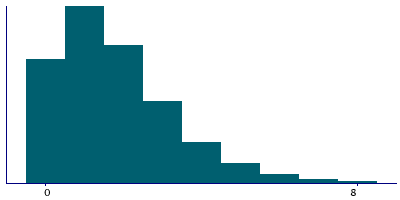
4 Instances
Instance 0 : Initial assessment visit (2006-2010) at which participants were recruited and consent given
501,076 participants, 501,076 items
| Maximum | 32 |
| Decile 9 | 4 |
| Decile 8 | 3 |
| Decile 7 | 2 |
| Decile 6 | 2 |
| Median | 1 |
| Decile 4 | 1 |
| Decile 3 | 1 |
| Decile 2 | 0 |
| Decile 1 | 0 |
| Minimum | 0 |
|
|
- There are 20 distinct values.
- Mean = 1.73071
- Std.dev = 1.55159
- 1179 items above graph maximum of 8
|
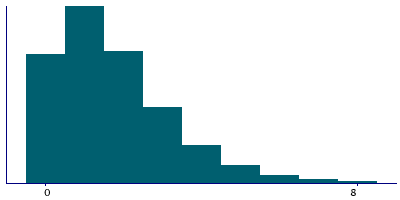
Instance 1 : First repeat assessment visit (2012-13)
20,313 participants, 20,313 items
| Maximum | 15 |
| Decile 9 | 4 |
| Decile 8 | 3 |
| Decile 7 | 2 |
| Decile 6 | 2 |
| Median | 1 |
| Decile 4 | 1 |
| Decile 3 | 1 |
| Decile 2 | 1 |
| Decile 1 | 0 |
| Minimum | 0 |
|
|
- There are 15 distinct values.
- Mean = 1.73519
- Std.dev = 1.46282
- 26 items above graph maximum of 8
|
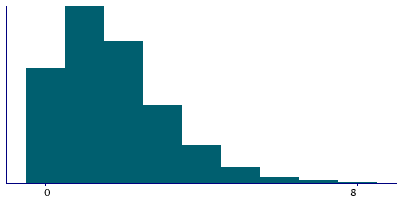
Instance 2 : Imaging visit (2014+)
89,066 participants, 89,066 items
| Maximum | 19 |
| Decile 9 | 4 |
| Decile 8 | 3 |
| Decile 7 | 3 |
| Decile 6 | 2 |
| Median | 2 |
| Decile 4 | 2 |
| Decile 3 | 1 |
| Decile 2 | 1 |
| Decile 1 | 0 |
| Minimum | 0 |
|
|
- There are 19 distinct values.
- Mean = 2.2314
- Std.dev = 1.75404
- 549 items above graph maximum of 8
|
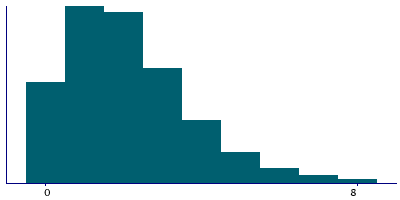
Instance 3 : First repeat imaging visit (2019+)
14,294 participants, 14,294 items
| Maximum | 19 |
| Decile 9 | 5 |
| Decile 8 | 4 |
| Decile 7 | 3 |
| Decile 6 | 3 |
| Median | 2 |
| Decile 4 | 2 |
| Decile 3 | 1 |
| Decile 2 | 1 |
| Decile 1 | 0 |
| Minimum | 0 |
|
|
- There are 17 distinct values.
- Mean = 2.49503
- Std.dev = 1.91108
- 20 items above graph maximum of 10
|

