Data
636,555 items of data are available, covering 496,989 participants.
Defined-instances run from 0 to 3, labelled using Instancing
2.
Units of measurement are cm.
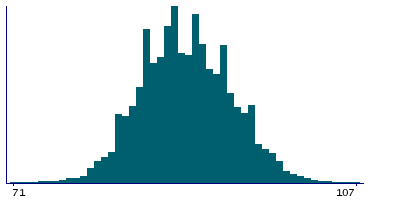
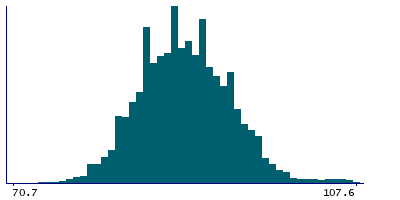
| Maximum | 125.5 |
| Decile 9 | 95 |
| Decile 8 | 93 |
| Decile 7 | 92 |
| Decile 6 | 90 |
| Median | 89 |
| Decile 4 | 88 |
| Decile 3 | 86 |
| Decile 2 | 85 |
| Decile 1 | 83 |
| Minimum | 20 |
|
|
- Mean = 89.109
- Std.dev = 4.89114
- 413 items below graph minimum of 71
- 598 items above graph maximum of 107
|
4 Instances
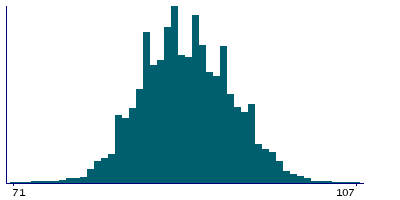
Instance 0 : Initial assessment visit (2006-2010) at which participants were recruited and consent given
495,666 participants, 495,666 items
| Maximum | 124 |
| Decile 9 | 95 |
| Decile 8 | 93 |
| Decile 7 | 92 |
| Decile 6 | 90 |
| Median | 89 |
| Decile 4 | 88 |
| Decile 3 | 86 |
| Decile 2 | 85 |
| Decile 1 | 83 |
| Minimum | 20 |
|
|
- Mean = 89.1432
- Std.dev = 4.88282
- 378 items below graph minimum of 71
- 289 items above graph maximum of 107
|
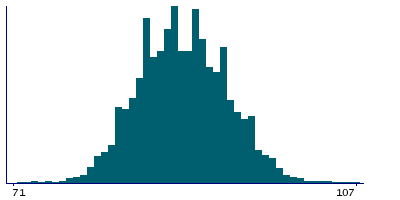
Instance 1 : First repeat assessment visit (2012-13)
20,293 participants, 20,293 items
| Maximum | 112 |
| Decile 9 | 95 |
| Decile 8 | 93 |
| Decile 7 | 91 |
| Decile 6 | 90 |
| Median | 89 |
| Decile 4 | 87 |
| Decile 3 | 86 |
| Decile 2 | 85 |
| Decile 1 | 83 |
| Minimum | 20 |
|
|
- Mean = 88.763
- Std.dev = 4.77187
- 9 items below graph minimum of 71
- 11 items above graph maximum of 107
|
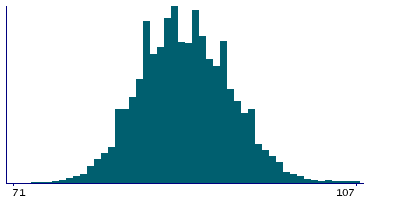
Instance 2 : Imaging visit (2014+)
99,774 participants, 99,774 items
| Maximum | 125.5 |
| Decile 9 | 95 |
| Decile 8 | 93 |
| Decile 7 | 91.5 |
| Decile 6 | 90 |
| Median | 89 |
| Decile 4 | 87.7 |
| Decile 3 | 86 |
| Decile 2 | 85 |
| Decile 1 | 83 |
| Minimum | 54.8 |
|
|
- Mean = 89.0352
- Std.dev = 4.92167
- 20 items below graph minimum of 71
- 232 items above graph maximum of 107
|
Instance 3 : First repeat imaging visit (2019+)
20,822 participants, 20,822 items
| Maximum | 122 |
| Decile 9 | 95 |
| Decile 8 | 93 |
| Decile 7 | 91.4 |
| Decile 6 | 90 |
| Median | 89 |
| Decile 4 | 87.5 |
| Decile 3 | 86 |
| Decile 2 | 85 |
| Decile 1 | 83 |
| Minimum | 66 |
|
|
- Mean = 88.9855
- Std.dev = 5.03605
- 6 items below graph minimum of 71
- 66 items above graph maximum of 107
|
