WARNING: the interactive features of this website use CSS3, which your browser does not support. To use the full features of this website, please update your browser.
Data
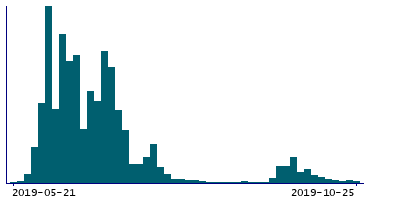
181,943 items of data are available, covering 181,943 participants.
Maximum
2020-01-16
Decile 9
2019-08-15
Decile 8
2019-07-11
Decile 7
2019-07-04
Decile 6
2019-07-01
Median
2019-06-24
Decile 4
2019-06-18
Decile 3
2019-06-14
Decile 2
2019-06-09
Decile 1
2019-06-05
Minimum
2019-05-21
Mean = 2019-07-04
4115 items above graph maximum of 2019-10-25
Notes
When food preferences questionnaire was completed by participant.