Data
40,538 items of data are available, covering 39,638 participants.
Defined-instances run from 2 to 3, labelled using Instancing
2.
Units of measurement are litres/min/m2.
| Maximum | 479.2 |
| Decile 9 | 3.2 |
| Decile 8 | 2.9 |
| Decile 7 | 2.7 |
| Decile 6 | 2.6 |
| Median | 2.5 |
| Decile 4 | 2.3 |
| Decile 3 | 2.2 |
| Decile 2 | 2.1 |
| Decile 1 | 1.9 |
| Minimum | 0 |
|

|
- Mean = 2.53635
- Std.dev = 2.49145
- 173 items above graph maximum of 4.5
|
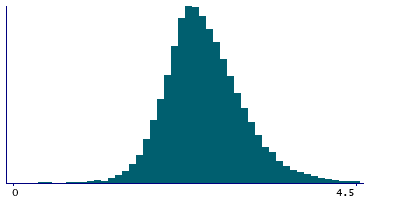
2 Instances
Instance 2 : Imaging visit (2014+)
39,558 participants, 39,558 items
| Maximum | 479.2 |
| Decile 9 | 3.2 |
| Decile 8 | 2.9 |
| Decile 7 | 2.7 |
| Decile 6 | 2.6 |
| Median | 2.5 |
| Decile 4 | 2.4 |
| Decile 3 | 2.2 |
| Decile 2 | 2.1 |
| Decile 1 | 1.9 |
| Minimum | 0 |
|
|
- Mean = 2.53769
- Std.dev = 2.52025
- 170 items above graph maximum of 4.5
|
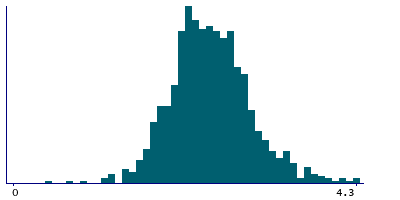
Instance 3 : First repeat imaging visit (2019+)
980 participants, 980 items
| Maximum | 12.5 |
| Decile 9 | 3.1 |
| Decile 8 | 2.8 |
| Decile 7 | 2.7 |
| Decile 6 | 2.6 |
| Median | 2.4 |
| Decile 4 | 2.3 |
| Decile 3 | 2.2 |
| Decile 2 | 2.1 |
| Decile 1 | 1.9 |
| Minimum | 0.4 |
|
|
- Mean = 2.48235
- Std.dev = 0.61424
- 3 items above graph maximum of 4.3
|
Notes
Cardiac index
0 Related Data-Fields
There are no related data-fields
0 Resources
There are no matching Resources
