Data
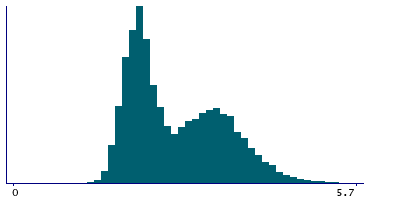
572,455 items of data are available, covering 492,479 participants.
Defined-instances run from 0 to 3, labelled using Instancing
2.
Units of measurement are Kg.
| Maximum | 24.9 |
| Decile 9 | 3.8 |
| Decile 8 | 3.5 |
| Decile 7 | 3.2 |
| Decile 6 | 2.9 |
| Median | 2.5 |
| Decile 4 | 2.3 |
| Decile 3 | 2.1 |
| Decile 2 | 2 |
| Decile 1 | 1.9 |
| Minimum | 0.9 |
|
|
- Mean = 2.70446
- Std.dev = 0.776826
- 245 items above graph maximum of 5.7
|
4 Instances
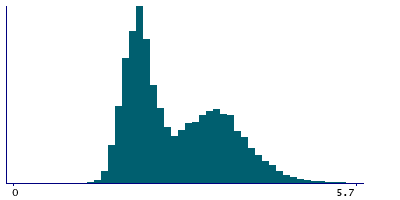
Instance 0 : Initial assessment visit (2006-2010) at which participants were recruited and consent given
491,661 participants, 491,661 items
| Maximum | 24.9 |
| Decile 9 | 3.8 |
| Decile 8 | 3.5 |
| Decile 7 | 3.2 |
| Decile 6 | 2.9 |
| Median | 2.5 |
| Decile 4 | 2.3 |
| Decile 3 | 2.1 |
| Decile 2 | 2 |
| Decile 1 | 1.9 |
| Minimum | 0.9 |
|
|
- Mean = 2.70959
- Std.dev = 0.783362
- 219 items above graph maximum of 5.7
|
Instance 1 : First repeat assessment visit (2012-13)
20,022 participants, 20,022 items
| Maximum | 6.5 |
| Decile 9 | 3.7 |
| Decile 8 | 3.4 |
| Decile 7 | 3.1 |
| Decile 6 | 2.8 |
| Median | 2.5 |
| Decile 4 | 2.2 |
| Decile 3 | 2.1 |
| Decile 2 | 2 |
| Decile 1 | 1.8 |
| Minimum | 0.9 |
|
|
- Mean = 2.65894
- Std.dev = 0.736714
- 6 items above graph maximum of 5.6
|
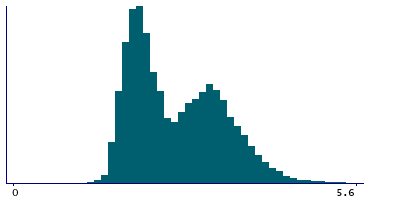
Instance 2 : Imaging visit (2014+)
55,607 participants, 55,607 items
| Maximum | 6.4 |
| Decile 9 | 3.7 |
| Decile 8 | 3.4 |
| Decile 7 | 3.1 |
| Decile 6 | 2.8 |
| Median | 2.5 |
| Decile 4 | 2.3 |
| Decile 3 | 2.1 |
| Decile 2 | 2 |
| Decile 1 | 1.9 |
| Minimum | 1.2 |
|
|
- Mean = 2.67836
- Std.dev = 0.734712
- 29 items above graph maximum of 5.5
|
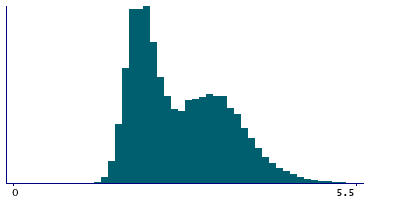
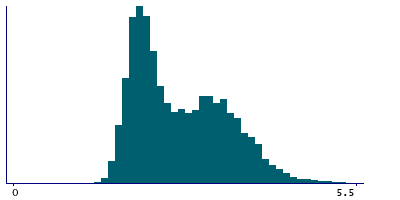
Instance 3 : First repeat imaging visit (2019+)
5,165 participants, 5,165 items
| Maximum | 6.1 |
| Decile 9 | 3.7 |
| Decile 8 | 3.4 |
| Decile 7 | 3.1 |
| Decile 6 | 2.8 |
| Median | 2.5 |
| Decile 4 | 2.3 |
| Decile 3 | 2.1 |
| Decile 2 | 2 |
| Decile 1 | 1.9 |
| Minimum | 1.4 |
|
|
- Mean = 2.67442
- Std.dev = 0.731262
- 2 items above graph maximum of 5.5
|


