Data
79,757 items of data are available, covering 75,232 participants.
Defined-instances run from 2 to 3, labelled using Instancing
2.
Units of measurement are mm2.
| Maximum | 3086.05 |
| Decile 9 | 1120.6 |
| Decile 8 | 1015.31 |
| Decile 7 | 947.625 |
| Decile 6 | 892.472 |
| Median | 844.84 |
| Decile 4 | 799.715 |
| Decile 3 | 754.59 |
| Decile 2 | 704.451 |
| Decile 1 | 641.778 |
| Minimum | 350.972 |
|

|
- Mean = 867.336
- Std.dev = 194.315
- 235 items above graph maximum of 1599.43
|
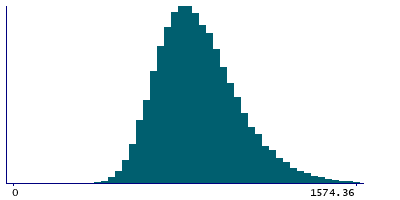
2 Instances
Instance 2 : Imaging visit (2014+)
75,014 participants, 75,014 items
| Maximum | 3086.05 |
| Decile 9 | 1123.11 |
| Decile 8 | 1015.31 |
| Decile 7 | 947.625 |
| Decile 6 | 894.979 |
| Median | 844.84 |
| Decile 4 | 799.715 |
| Decile 3 | 754.59 |
| Decile 2 | 704.451 |
| Decile 1 | 641.778 |
| Minimum | 350.972 |
|
|
- Mean = 867.881
- Std.dev = 194.465
- 220 items above graph maximum of 1604.44
|
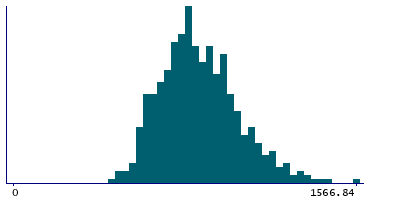
Instance 3 : First repeat imaging visit (2019+)
4,743 participants, 4,743 items
| Maximum | 2153.47 |
| Decile 9 | 1108.07 |
| Decile 8 | 1007.79 |
| Decile 7 | 937.597 |
| Decile 6 | 884.951 |
| Median | 834.813 |
| Decile 4 | 792.195 |
| Decile 3 | 747.07 |
| Decile 2 | 694.424 |
| Decile 1 | 639.271 |
| Minimum | 391.083 |
|
|
- Mean = 858.728
- Std.dev = 191.725
- 13 items above graph maximum of 1576.87
|
Notes
Ascending aorta maximum area
0 Related Data-Fields
There are no related data-fields
0 Resources
There are no matching Resources
