Data
79,757 items of data are available, covering 75,232 participants.
Defined-instances run from 2 to 3, labelled using Instancing
2.
Units of measurement are mm2.
| Maximum | 1348.74 |
| Decile 9 | 614.201 |
| Decile 8 | 561.556 |
| Decile 7 | 526.458 |
| Decile 6 | 496.375 |
| Median | 471.306 |
| Decile 4 | 446.236 |
| Decile 3 | 421.167 |
| Decile 2 | 396.097 |
| Decile 1 | 363.507 |
| Minimum | 120.333 |
|

|
- Mean = 482.228
- Std.dev = 100.614
- 161 items above graph maximum of 864.896
|
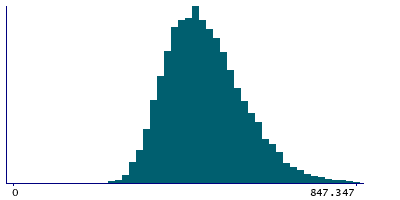
2 Instances
Instance 2 : Imaging visit (2014+)
75,014 participants, 75,014 items
| Maximum | 1348.74 |
| Decile 9 | 614.201 |
| Decile 8 | 561.556 |
| Decile 7 | 526.458 |
| Decile 6 | 496.375 |
| Median | 471.306 |
| Decile 4 | 446.236 |
| Decile 3 | 421.167 |
| Decile 2 | 396.097 |
| Decile 1 | 363.507 |
| Minimum | 120.333 |
|
|
- Mean = 482.395
- Std.dev = 100.666
- 154 items above graph maximum of 864.896
|
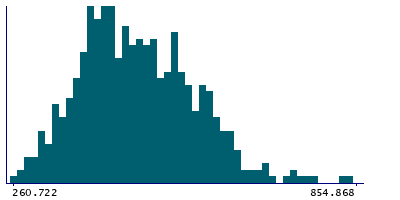
Instance 3 : First repeat imaging visit (2019+)
4,743 participants, 4,743 items
| Maximum | 1183.28 |
| Decile 9 | 609.188 |
| Decile 8 | 561.556 |
| Decile 7 | 523.951 |
| Decile 6 | 493.868 |
| Median | 468.799 |
| Decile 4 | 443.729 |
| Decile 3 | 418.66 |
| Decile 2 | 393.59 |
| Decile 1 | 361 |
| Minimum | 248.188 |
|
|
- Mean = 479.592
- Std.dev = 99.7509
- 9 items above graph maximum of 857.375
|
Notes
Descending aorta maximum area
0 Related Data-Fields
There are no related data-fields
0 Resources
There are no matching Resources
