Data
457,927 items of data are available, covering 210,739 participants.
Defined-instances run from 0 to 4, labelled using Instancing
1.
Units of measurement are ug.
| Maximum | 2773.73 |
| Decile 9 | 464.503 |
| Decile 8 | 401.069 |
| Decile 7 | 360.021 |
| Decile 6 | 327.717 |
| Median | 299.026 |
| Decile 4 | 271.782 |
| Decile 3 | 244.156 |
| Decile 2 | 213.503 |
| Decile 1 | 173.791 |
| Minimum | 0 |
|
|
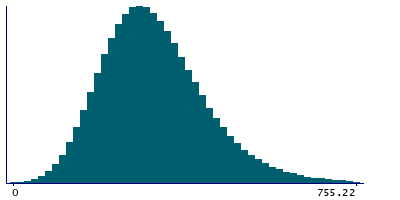
- Mean = 312.21
- Std.dev = 120.283
- 1793 items above graph maximum of 755.214
|
5 Instances
Instance 0 : Conducted in assessment centre, April 2009 to September 2010.
70,630 participants, 70,630 items
| Maximum | 2773.73 |
| Decile 9 | 480.553 |
| Decile 8 | 412.057 |
| Decile 7 | 368.082 |
| Decile 6 | 333.578 |
| Median | 302.968 |
| Decile 4 | 273.619 |
| Decile 3 | 244.12 |
| Decile 2 | 211.257 |
| Decile 1 | 167.965 |
| Minimum | 0 |
|
|
- Mean = 317.307
- Std.dev = 130.236
- 308 items above graph maximum of 793.141
|
Instance 1 : On-line cycle 1, February 2011 to April 2011.
100,447 participants, 100,447 items
| Maximum | 1923.19 |
| Decile 9 | 464.163 |
| Decile 8 | 401.827 |
| Decile 7 | 360.815 |
| Decile 6 | 328.919 |
| Median | 300.319 |
| Decile 4 | 273.042 |
| Decile 3 | 245.437 |
| Decile 2 | 215.421 |
| Decile 1 | 176.083 |
| Minimum | 0 |
|
|
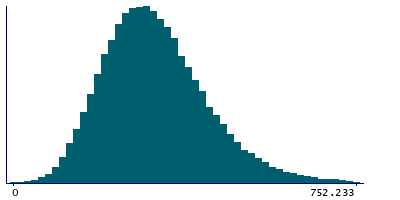
- Mean = 313.321
- Std.dev = 118.999
- 364 items above graph maximum of 752.243
|
Instance 2 : On-line cycle 2, June 2011 to September 2011.
83,140 participants, 83,140 items
| Maximum | 2320.36 |
| Decile 9 | 462.142 |
| Decile 8 | 399.969 |
| Decile 7 | 359.75 |
| Decile 6 | 327.336 |
| Median | 298.793 |
| Decile 4 | 271.784 |
| Decile 3 | 244.124 |
| Decile 2 | 213.392 |
| Decile 1 | 174.198 |
| Minimum | 0 |
|

|
- Mean = 311.569
- Std.dev = 118.817
- 315 items above graph maximum of 750.086
|
Instance 3 : On-line cycle 3, October 2011 to December 2011.
103,616 participants, 103,616 items
| Maximum | 2044.83 |
| Decile 9 | 457.783 |
| Decile 8 | 395.447 |
| Decile 7 | 355.054 |
| Decile 6 | 323.203 |
| Median | 294.884 |
| Decile 4 | 268.458 |
| Decile 3 | 241.414 |
| Decile 2 | 211.235 |
| Decile 1 | 172.812 |
| Minimum | 0 |
|

|
- Mean = 308.23
- Std.dev = 117.655
- 400 items above graph maximum of 742.754
|
Instance 4 : On-line cycle 4, April 2012 to June 2012.
100,094 participants, 100,094 items
| Maximum | 2446.92 |
| Decile 9 | 461.496 |
| Decile 8 | 399.126 |
| Decile 7 | 359.085 |
| Decile 6 | 327.686 |
| Median | 299.797 |
| Decile 4 | 272.762 |
| Decile 3 | 245.752 |
| Decile 2 | 215.596 |
| Decile 1 | 176.111 |
| Minimum | 0 |
|

|
- Mean = 312.15
- Std.dev = 117.98
- 390 items above graph maximum of 746.88
|
