Data
457,927 items of data are available, covering 210,739 participants.
Defined-instances run from 0 to 4, labelled using Instancing
1.
Units of measurement are ug.
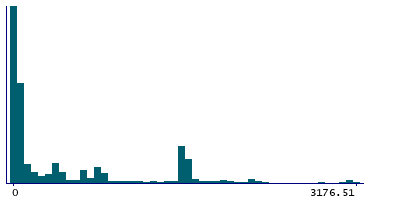
| Maximum | 10273.3 |
| Decile 9 | 1590.23 |
| Decile 8 | 1173.12 |
| Decile 7 | 636.485 |
| Decile 6 | 250.655 |
| Median | 69.9737 |
| Decile 4 | 35.519 |
| Decile 3 | 19.4889 |
| Decile 2 | 12.35 |
| Decile 1 | 3.945 |
| Minimum | 0 |
|
|
- Mean = 511.997
- Std.dev = 762.426
- 3832 items above graph maximum of 3176.51
|
5 Instances
Instance 0 : Conducted in assessment centre, April 2009 to September 2010.
70,630 participants, 70,630 items
| Maximum | 9156.43 |
| Decile 9 | 1601.72 |
| Decile 8 | 1474.47 |
| Decile 7 | 647.32 |
| Decile 6 | 213.64 |
| Median | 64.5806 |
| Decile 4 | 32.45 |
| Decile 3 | 18.0144 |
| Decile 2 | 12 |
| Decile 1 | 3.4334 |
| Minimum | 0 |
|
|
- Mean = 538.521
- Std.dev = 813.169
- 728 items above graph maximum of 3200.02
|
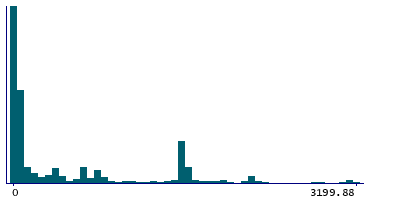
Instance 1 : On-line cycle 1, February 2011 to April 2011.
100,447 participants, 100,447 items
| Maximum | 10273.3 |
| Decile 9 | 1595.53 |
| Decile 8 | 1482.93 |
| Decile 7 | 659.299 |
| Decile 6 | 354.688 |
| Median | 81.7024 |
| Decile 4 | 39.7207 |
| Decile 3 | 20.7992 |
| Decile 2 | 12.9666 |
| Decile 1 | 4.3081 |
| Minimum | 0 |
|

|
- Mean = 543.883
- Std.dev = 778.468
- 861 items above graph maximum of 3186.75
|
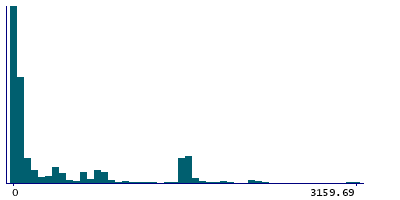
Instance 2 : On-line cycle 2, June 2011 to September 2011.
83,140 participants, 83,140 items
| Maximum | 7343.7 |
| Decile 9 | 1581.81 |
| Decile 8 | 814.604 |
| Decile 7 | 408.204 |
| Decile 6 | 121.835 |
| Median | 59.3991 |
| Decile 4 | 33.04 |
| Decile 3 | 18.9612 |
| Decile 2 | 12 |
| Decile 1 | 3.88 |
| Minimum | 0 |
|
|
- Mean = 445.626
- Std.dev = 711.004
- 642 items above graph maximum of 3159.73
|
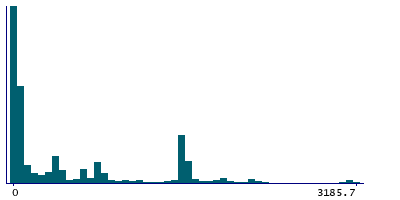
Instance 3 : On-line cycle 3, October 2011 to December 2011.
103,616 participants, 103,616 items
| Maximum | 9082.14 |
| Decile 9 | 1594.91 |
| Decile 8 | 1522.31 |
| Decile 7 | 694.64 |
| Decile 6 | 391.058 |
| Median | 92.5942 |
| Decile 4 | 41.3259 |
| Decile 3 | 21.2597 |
| Decile 2 | 12.945 |
| Decile 1 | 4.1545 |
| Minimum | 0 |
|
|
- Mean = 556.016
- Std.dev = 777.829
- 877 items above graph maximum of 3185.67
|
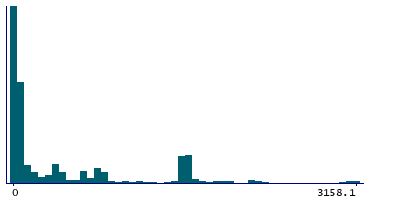
Instance 4 : On-line cycle 4, April 2012 to June 2012.
100,094 participants, 100,094 items
| Maximum | 9131.86 |
| Decile 9 | 1581.02 |
| Decile 8 | 847.077 |
| Decile 7 | 444.149 |
| Decile 6 | 176.356 |
| Median | 59.9125 |
| Decile 4 | 32.5525 |
| Decile 3 | 18.5598 |
| Decile 2 | 12.0056 |
| Decile 1 | 3.8975 |
| Minimum | 0 |
|
|
- Mean = 470.845
- Std.dev = 727.713
- 751 items above graph maximum of 3158.15
|
