Data
457,927 items of data are available, covering 210,739 participants.
Defined-instances run from 0 to 4, labelled using Instancing
1.
Units of measurement are ug.
| Maximum | 3238.06 |
| Decile 9 | 347.418 |
| Decile 8 | 264.523 |
| Decile 7 | 228.548 |
| Decile 6 | 203.135 |
| Median | 182.714 |
| Decile 4 | 164.09 |
| Decile 3 | 145.558 |
| Decile 2 | 125.413 |
| Decile 1 | 99.166 |
| Minimum | 0 |
|
|
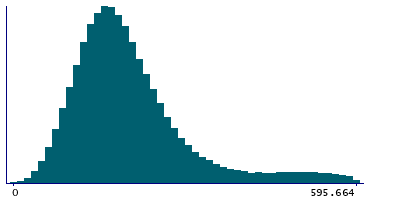
- Mean = 210.058
- Std.dev = 121.55
- 7004 items above graph maximum of 595.671
|
5 Instances
Instance 0 : Conducted in assessment centre, April 2009 to September 2010.
70,630 participants, 70,630 items
| Maximum | 3238.06 |
| Decile 9 | 348.946 |
| Decile 8 | 265.357 |
| Decile 7 | 228.217 |
| Decile 6 | 202.57 |
| Median | 181.595 |
| Decile 4 | 162.419 |
| Decile 3 | 143.317 |
| Decile 2 | 122.658 |
| Decile 1 | 95.5829 |
| Minimum | 0 |
|

|
- Mean = 208.918
- Std.dev = 124.283
- 1022 items above graph maximum of 602.309
|
Instance 1 : On-line cycle 1, February 2011 to April 2011.
100,447 participants, 100,447 items
| Maximum | 2050.51 |
| Decile 9 | 354.573 |
| Decile 8 | 267.579 |
| Decile 7 | 230.81 |
| Decile 6 | 205.45 |
| Median | 184.568 |
| Decile 4 | 166.042 |
| Decile 3 | 147.513 |
| Decile 2 | 127.216 |
| Decile 1 | 100.888 |
| Minimum | 0 |
|

|
- Mean = 212.838
- Std.dev = 122.896
- 1409 items above graph maximum of 608.259
|
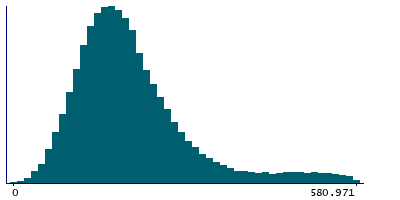
Instance 2 : On-line cycle 2, June 2011 to September 2011.
83,140 participants, 83,140 items
| Maximum | 2189.12 |
| Decile 9 | 340.257 |
| Decile 8 | 262.321 |
| Decile 7 | 227.023 |
| Decile 6 | 201.814 |
| Median | 182.145 |
| Decile 4 | 163.568 |
| Decile 3 | 145.126 |
| Decile 2 | 125.355 |
| Decile 1 | 99.5434 |
| Minimum | 0 |
|
|
- Mean = 208.462
- Std.dev = 119.508
- 1447 items above graph maximum of 580.971
|
Instance 3 : On-line cycle 3, October 2011 to December 2011.
103,616 participants, 103,616 items
| Maximum | 2019.42 |
| Decile 9 | 343.304 |
| Decile 8 | 261.978 |
| Decile 7 | 226.635 |
| Decile 6 | 201.757 |
| Median | 181.281 |
| Decile 4 | 162.68 |
| Decile 3 | 144.425 |
| Decile 2 | 124.483 |
| Decile 1 | 98.7663 |
| Minimum | 0 |
|

|
- Mean = 208.337
- Std.dev = 120.19
- 1653 items above graph maximum of 587.842
|
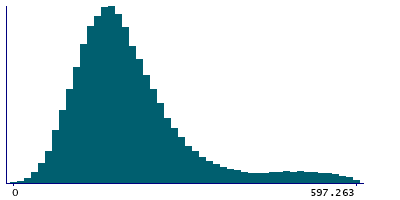
Instance 4 : On-line cycle 4, April 2012 to June 2012.
100,094 participants, 100,094 items
| Maximum | 1790.7 |
| Decile 9 | 348.818 |
| Decile 8 | 265.668 |
| Decile 7 | 229.735 |
| Decile 6 | 204.121 |
| Median | 183.561 |
| Decile 4 | 165.246 |
| Decile 3 | 146.669 |
| Decile 2 | 126.477 |
| Decile 1 | 100.364 |
| Minimum | 0 |
|
|
- Mean = 211.18
- Std.dev = 121.26
- 1503 items above graph maximum of 597.272
|
