Data
87,996 items of data are available, covering 83,313 participants.
Defined-instances run from 2 to 3, labelled using Instancing
2.
Units of measurement are AU.
| Maximum | 111.091 |
| Decile 9 | 80.602 |
| Decile 8 | 78.9764 |
| Decile 7 | 77.7788 |
| Decile 6 | 76.7041 |
| Median | 75.6587 |
| Decile 4 | 74.5863 |
| Decile 3 | 73.3883 |
| Decile 2 | 71.9314 |
| Decile 1 | 69.784 |
| Minimum | 0 |
|

|
- Mean = 75.3645
- Std.dev = 4.35224
- 155 items below graph minimum of 58.9661
- 2 items above graph maximum of 91.4199
|
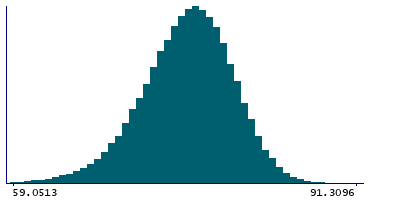
2 Instances
Instance 2 : Imaging visit (2014+)
83,241 participants, 83,241 items
| Maximum | 92.0239 |
| Decile 9 | 80.6114 |
| Decile 8 | 78.9867 |
| Decile 7 | 77.7871 |
| Decile 6 | 76.7137 |
| Median | 75.6684 |
| Decile 4 | 74.6008 |
| Decile 3 | 73.4052 |
| Decile 2 | 71.951 |
| Decile 1 | 69.7961 |
| Minimum | 0 |
|
|
- Mean = 75.3754
- Std.dev = 4.34891
- 146 items below graph minimum of 58.9808
- 1 item above graph maximum of 91.4266
|
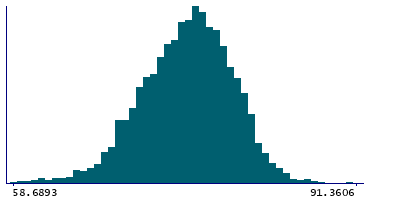
Instance 3 : First repeat imaging visit (2019+)
4,755 participants, 4,755 items
| Maximum | 111.091 |
| Decile 9 | 80.4701 |
| Decile 8 | 78.8545 |
| Decile 7 | 77.6416 |
| Decile 6 | 76.5294 |
| Median | 75.4885 |
| Decile 4 | 74.3776 |
| Decile 3 | 73.0985 |
| Decile 2 | 71.5725 |
| Decile 1 | 69.5797 |
| Minimum | 43.5972 |
|
|
- Mean = 75.1738
- Std.dev = 4.40582
- 8 items below graph minimum of 58.6893
- 1 item above graph maximum of 91.3606
|
Notes
Mean intensity of Optic-Chiasm in the whole brain generated by subcortical volumetric segmentation (aseg)
0 Related Data-Fields
There are no related data-fields
Problem running reference query
0 Resources
There are no matching Resources
