Data
87,996 items of data are available, covering 83,313 participants.
Defined-instances run from 2 to 3, labelled using Instancing
2.
Units of measurement are AU.
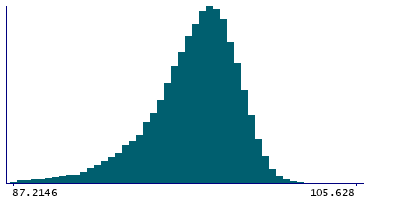
| Maximum | 120.518 |
| Decile 9 | 99.4385 |
| Decile 8 | 98.7004 |
| Decile 7 | 98.1315 |
| Decile 6 | 97.5988 |
| Median | 97.0572 |
| Decile 4 | 96.456 |
| Decile 3 | 95.745 |
| Decile 2 | 94.7696 |
| Decile 1 | 93.0748 |
| Minimum | 59.9159 |
|
|
- Mean = 96.4369
- Std.dev = 3.29098
- 1598 items below graph minimum of 86.7112
- 9 items above graph maximum of 105.802
|
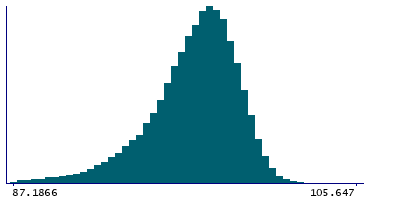
2 Instances
Instance 2 : Imaging visit (2014+)
83,241 participants, 83,241 items
| Maximum | 120.518 |
| Decile 9 | 99.4381 |
| Decile 8 | 98.701 |
| Decile 7 | 98.1303 |
| Decile 6 | 97.5948 |
| Median | 97.0485 |
| Decile 4 | 96.4449 |
| Decile 3 | 95.7319 |
| Decile 2 | 94.7527 |
| Decile 1 | 93.046 |
| Minimum | 59.9159 |
|
|
- Mean = 96.4238
- Std.dev = 3.31296
- 1537 items below graph minimum of 86.6539
- 9 items above graph maximum of 105.83
|
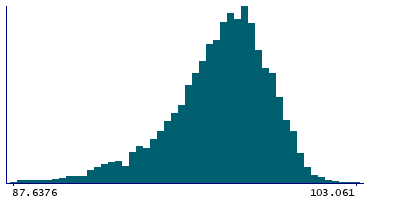
Instance 3 : First repeat imaging visit (2019+)
4,755 participants, 4,755 items
| Maximum | 103.061 |
| Decile 9 | 99.4407 |
| Decile 8 | 98.6867 |
| Decile 7 | 98.1489 |
| Decile 6 | 97.655 |
| Median | 97.1736 |
| Decile 4 | 96.6027 |
| Decile 3 | 95.9648 |
| Decile 2 | 95.0732 |
| Decile 1 | 93.5391 |
| Minimum | 69.251 |
|
|
- Mean = 96.6662
- Std.dev = 2.86947
- 67 items below graph minimum of 87.6376
|
Notes
Mean intensity of CC-Posterior in the whole brain generated by subcortical volumetric segmentation (aseg)
0 Related Data-Fields
There are no related data-fields
0 Resources
There are no matching Resources
