Data
87,996 items of data are available, covering 83,313 participants.
Defined-instances run from 2 to 3, labelled using Instancing
2.
Units of measurement are AU.
| Maximum | 93.0671 |
| Decile 9 | 87.085 |
| Decile 8 | 86.5307 |
| Decile 7 | 86.1286 |
| Decile 6 | 85.7886 |
| Median | 85.456 |
| Decile 4 | 85.1275 |
| Decile 3 | 84.7823 |
| Decile 2 | 84.3765 |
| Decile 1 | 83.8468 |
| Minimum | 56.622 |
|

|
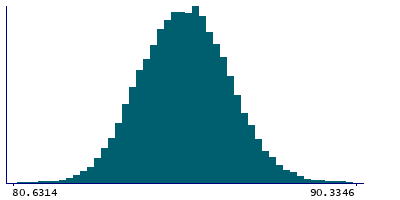
- Mean = 85.4599
- Std.dev = 1.32118
- 161 items below graph minimum of 80.6086
- 60 items above graph maximum of 90.3232
|
2 Instances
Instance 2 : Imaging visit (2014+)
83,241 participants, 83,241 items
| Maximum | 93.0671 |
| Decile 9 | 87.0962 |
| Decile 8 | 86.5405 |
| Decile 7 | 86.1369 |
| Decile 6 | 85.7978 |
| Median | 85.4646 |
| Decile 4 | 85.1356 |
| Decile 3 | 84.7891 |
| Decile 2 | 84.3823 |
| Decile 1 | 83.8514 |
| Minimum | 56.622 |
|
|
- Mean = 85.468
- Std.dev = 1.31921
- 150 items below graph minimum of 80.6066
- 57 items above graph maximum of 90.341
|
Instance 3 : First repeat imaging visit (2019+)
4,755 participants, 4,755 items
| Maximum | 90.7442 |
| Decile 9 | 86.8926 |
| Decile 8 | 86.3634 |
| Decile 7 | 85.9822 |
| Decile 6 | 85.6357 |
| Median | 85.3125 |
| Decile 4 | 85.0086 |
| Decile 3 | 84.6576 |
| Decile 2 | 84.2656 |
| Decile 1 | 83.7749 |
| Minimum | 62.1644 |
|

|
- Mean = 85.3169
- Std.dev = 1.34721
- 11 items below graph minimum of 80.6571
- 5 items above graph maximum of 90.0104
|
Notes
Mean intensity of Cerebellum-White-Matter in the left hemisphere generated by subcortical volumetric segmentation (aseg)
0 Related Data-Fields
There are no related data-fields
0 Resources
There are no matching Resources
