Data
87,995 items of data are available, covering 83,312 participants.
Defined-instances run from 2 to 3, labelled using Instancing
2.
Units of measurement are AU.
| Maximum | 93.8203 |
| Decile 9 | 88.9232 |
| Decile 8 | 88.1468 |
| Decile 7 | 87.6666 |
| Decile 6 | 87.2886 |
| Median | 86.9481 |
| Decile 4 | 86.5954 |
| Decile 3 | 86.1864 |
| Decile 2 | 85.557 |
| Decile 1 | 84.4358 |
| Minimum | 68.7268 |
|
|
- Mean = 86.8091
- Std.dev = 1.82729
- 233 items below graph minimum of 79.9484
- 2 items above graph maximum of 93.4106
|
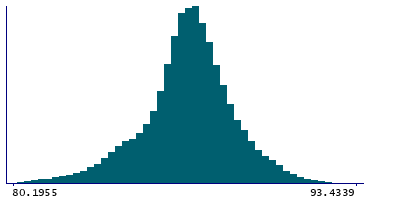
2 Instances
Instance 2 : Imaging visit (2014+)
83,240 participants, 83,240 items
| Maximum | 93.8203 |
| Decile 9 | 88.9129 |
| Decile 8 | 88.1375 |
| Decile 7 | 87.6574 |
| Decile 6 | 87.2793 |
| Median | 86.937 |
| Decile 4 | 86.5854 |
| Decile 3 | 86.1739 |
| Decile 2 | 85.5394 |
| Decile 1 | 84.4243 |
| Minimum | 69.2517 |
|

|
- Mean = 86.7979
- Std.dev = 1.82944
- 221 items below graph minimum of 79.9357
- 2 items above graph maximum of 93.4015
|
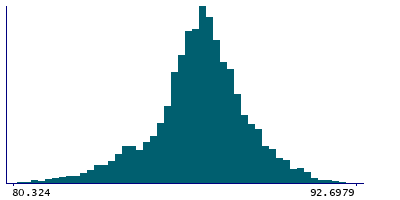
Instance 3 : First repeat imaging visit (2019+)
4,755 participants, 4,755 items
| Maximum | 92.6979 |
| Decile 9 | 89.0847 |
| Decile 8 | 88.2855 |
| Decile 7 | 87.8182 |
| Decile 6 | 87.435 |
| Median | 87.1172 |
| Decile 4 | 86.7763 |
| Decile 3 | 86.3929 |
| Decile 2 | 85.8827 |
| Decile 1 | 84.7048 |
| Minimum | 68.7268 |
|
|
- Mean = 87.0043
- Std.dev = 1.77785
- 9 items below graph minimum of 80.325
|
Notes
Mean intensity of Thalamus-Proper in the left hemisphere generated by subcortical volumetric segmentation (aseg)
0 Related Data-Fields
There are no related data-fields
0 Resources
There are no matching Resources
