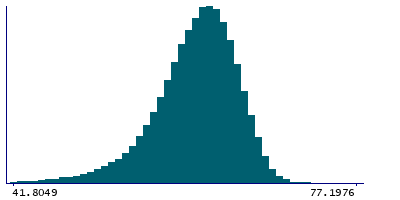
Data
87,996 items of data are available, covering 83,313 participants.
Defined-instances run from 2 to 3, labelled using Instancing
2.
Units of measurement are AU.
| Maximum | 102 |
| Decile 9 | 65.3333 |
| Decile 8 | 63.9206 |
| Decile 7 | 62.8182 |
| Decile 6 | 61.8 |
| Median | 60.8 |
| Decile 4 | 59.7143 |
| Decile 3 | 58.4444 |
| Decile 2 | 56.7368 |
| Decile 1 | 53.5556 |
| Minimum | 0 |
|
|
- Mean = 58.5426
- Std.dev = 11.288
- 2912 items below graph minimum of 41.7779
- 44 items above graph maximum of 77.111
|
2 Instances
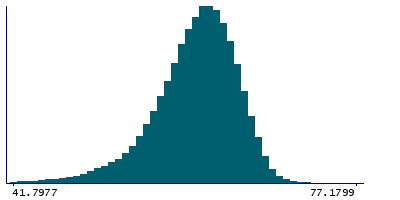
Instance 2 : Imaging visit (2014+)
83,241 participants, 83,241 items
| Maximum | 102 |
| Decile 9 | 65.3333 |
| Decile 8 | 63.9016 |
| Decile 7 | 62.8 |
| Decile 6 | 61.7778 |
| Median | 60.7778 |
| Decile 4 | 59.6967 |
| Decile 3 | 58.4286 |
| Decile 2 | 56.7188 |
| Decile 1 | 53.5478 |
| Minimum | 0 |
|
|
- Mean = 58.5504
- Std.dev = 11.2218
- 2718 items below graph minimum of 41.7622
- 41 items above graph maximum of 77.1188
|
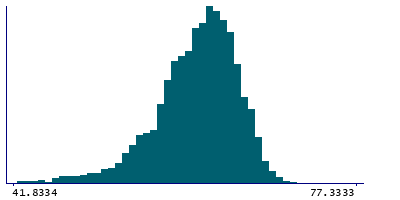
Instance 3 : First repeat imaging visit (2019+)
4,755 participants, 4,755 items
| Maximum | 99 |
| Decile 9 | 65.5 |
| Decile 8 | 64.1667 |
| Decile 7 | 63.125 |
| Decile 6 | 62.1667 |
| Median | 61.1291 |
| Decile 4 | 60 |
| Decile 3 | 58.6894 |
| Decile 2 | 57.0741 |
| Decile 1 | 53.6667 |
| Minimum | 0 |
|
|
- Mean = 58.4071
- Std.dev = 12.3879
- 194 items below graph minimum of 41.8334
- 3 items above graph maximum of 77.3333
|
Notes
Mean intensity of vessel in the left hemisphere generated by subcortical volumetric segmentation (aseg)
0 Related Data-Fields
There are no related data-fields
0 Resources
There are no matching Resources
Problem running application query
