Data
87,995 items of data are available, covering 83,312 participants.
Defined-instances run from 2 to 3, labelled using Instancing
2.
Units of measurement are AU.
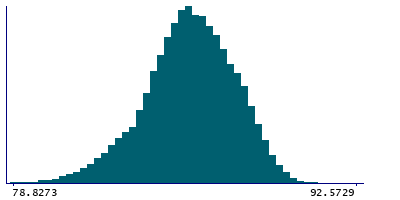
| Maximum | 92.5729 |
| Decile 9 | 88.0687 |
| Decile 8 | 87.3537 |
| Decile 7 | 86.7921 |
| Decile 6 | 86.3097 |
| Median | 85.853 |
| Decile 4 | 85.4188 |
| Decile 3 | 84.935 |
| Decile 2 | 84.331 |
| Decile 1 | 83.3204 |
| Minimum | 55.258 |
|
|
- Mean = 85.7598
- Std.dev = 1.87336
- 152 items below graph minimum of 78.572
|
2 Instances
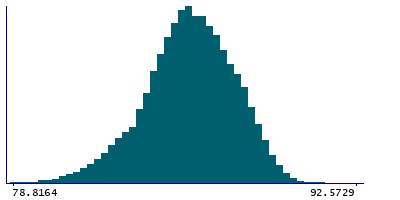
Instance 2 : Imaging visit (2014+)
83,240 participants, 83,240 items
| Maximum | 92.5729 |
| Decile 9 | 88.0605 |
| Decile 8 | 87.3431 |
| Decile 7 | 86.7796 |
| Decile 6 | 86.2972 |
| Median | 85.8416 |
| Decile 4 | 85.4052 |
| Decile 3 | 84.9219 |
| Decile 2 | 84.3204 |
| Decile 1 | 83.3048 |
| Minimum | 55.258 |
|
|
- Mean = 85.7481
- Std.dev = 1.87394
- 145 items below graph minimum of 78.5491
|
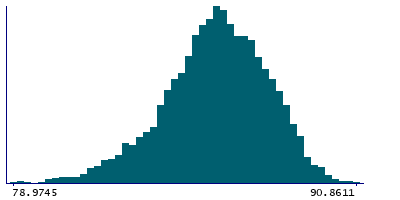
Instance 3 : First repeat imaging visit (2019+)
4,755 participants, 4,755 items
| Maximum | 90.8611 |
| Decile 9 | 88.2015 |
| Decile 8 | 87.5223 |
| Decile 7 | 87.0028 |
| Decile 6 | 86.5035 |
| Median | 86.0773 |
| Decile 4 | 85.653 |
| Decile 3 | 85.1873 |
| Decile 2 | 84.5522 |
| Decile 1 | 83.5886 |
| Minimum | 64.6104 |
|
|
- Mean = 85.9654
- Std.dev = 1.85113
- 4 items below graph minimum of 78.9757
|
Notes
Mean intensity of Thalamus-Proper in the right hemisphere generated by subcortical volumetric segmentation (aseg)
0 Related Data-Fields
There are no related data-fields
0 Resources
There are no matching Resources
