Data
87,996 items of data are available, covering 83,313 participants.
Defined-instances run from 2 to 3, labelled using Instancing
2.
Units of measurement are AU.
| Maximum | 118.535 |
| Decile 9 | 100.719 |
| Decile 8 | 100.199 |
| Decile 7 | 99.8214 |
| Decile 6 | 99.4896 |
| Median | 99.161 |
| Decile 4 | 98.8214 |
| Decile 3 | 98.4346 |
| Decile 2 | 97.948 |
| Decile 1 | 97.1034 |
| Minimum | 66.4896 |
|

|
- Mean = 98.973
- Std.dev = 1.66595
- 854 items below graph minimum of 93.4879
- 63 items above graph maximum of 104.334
|
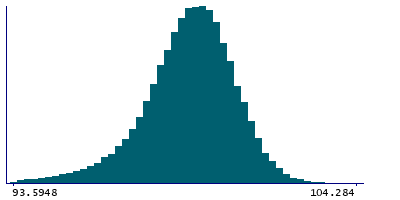
2 Instances
Instance 2 : Imaging visit (2014+)
83,241 participants, 83,241 items
| Maximum | 118.535 |
| Decile 9 | 100.72 |
| Decile 8 | 100.197 |
| Decile 7 | 99.8198 |
| Decile 6 | 99.4871 |
| Median | 99.1581 |
| Decile 4 | 98.818 |
| Decile 3 | 98.4297 |
| Decile 2 | 97.9421 |
| Decile 1 | 97.0913 |
| Minimum | 66.4896 |
|
|
- Mean = 98.9697
- Std.dev = 1.66593
- 808 items below graph minimum of 93.4623
- 61 items above graph maximum of 104.349
|
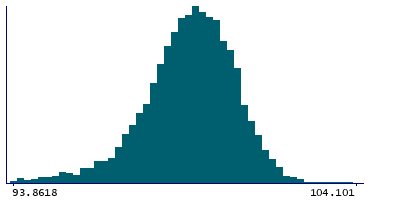
Instance 3 : First repeat imaging visit (2019+)
4,755 participants, 4,755 items
| Maximum | 109.582 |
| Decile 9 | 100.684 |
| Decile 8 | 100.234 |
| Decile 7 | 99.8641 |
| Decile 6 | 99.524 |
| Median | 99.216 |
| Decile 4 | 98.8874 |
| Decile 3 | 98.5162 |
| Decile 2 | 98.0567 |
| Decile 1 | 97.2774 |
| Minimum | 71.9573 |
|
|
- Mean = 99.0306
- Std.dev = 1.66529
- 51 items below graph minimum of 93.8705
- 3 items above graph maximum of 104.091
|
Notes
Mean intensity of Pallidum in the right hemisphere generated by subcortical volumetric segmentation (aseg)
0 Related Data-Fields
There are no related data-fields
0 Resources
There are no matching Resources
