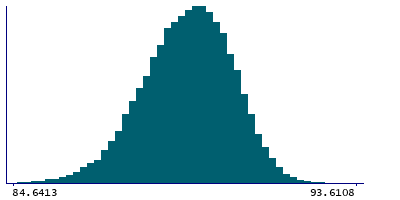
Data
87,996 items of data are available, covering 83,313 participants.
Defined-instances run from 2 to 3, labelled using Instancing
2.
Units of measurement are AU.
| Maximum | 97.403 |
| Decile 9 | 90.6388 |
| Decile 8 | 90.1975 |
| Decile 7 | 89.8593 |
| Decile 6 | 89.5504 |
| Median | 89.2468 |
| Decile 4 | 88.9323 |
| Decile 3 | 88.5918 |
| Decile 2 | 88.1859 |
| Decile 1 | 87.6054 |
| Minimum | 65.5924 |
|
|
- Mean = 89.1583
- Std.dev = 1.26415
- 253 items below graph minimum of 84.572
- 2 items above graph maximum of 93.6722
|
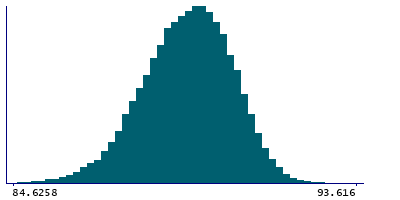
2 Instances
Instance 2 : Imaging visit (2014+)
83,241 participants, 83,241 items
| Maximum | 97.403 |
| Decile 9 | 90.6386 |
| Decile 8 | 90.1968 |
| Decile 7 | 89.8571 |
| Decile 6 | 89.5478 |
| Median | 89.2435 |
| Decile 4 | 88.9279 |
| Decile 3 | 88.587 |
| Decile 2 | 88.1795 |
| Decile 1 | 87.5996 |
| Minimum | 66.988 |
|
|
- Mean = 89.1549
- Std.dev = 1.26401
- 239 items below graph minimum of 84.5606
- 1 item above graph maximum of 93.6776
|
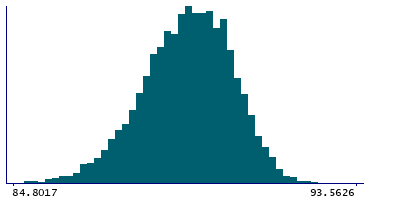
Instance 3 : First repeat imaging visit (2019+)
4,755 participants, 4,755 items
| Maximum | 93.9064 |
| Decile 9 | 90.6406 |
| Decile 8 | 90.212 |
| Decile 7 | 89.8924 |
| Decile 6 | 89.5947 |
| Median | 89.3015 |
| Decile 4 | 89.0129 |
| Decile 3 | 88.6706 |
| Decile 2 | 88.2944 |
| Decile 1 | 87.7233 |
| Minimum | 65.5924 |
|
|
- Mean = 89.2176
- Std.dev = 1.26497
- 10 items below graph minimum of 84.8059
- 1 item above graph maximum of 93.558
|
Notes
Mean intensity of VentralDC in the right hemisphere generated by subcortical volumetric segmentation (aseg)
0 Related Data-Fields
There are no related data-fields
0 Resources
There are no matching Resources
