Data
87,996 items of data are available, covering 83,313 participants.
Defined-instances run from 2 to 3, labelled using Instancing
2.
Units of measurement are mm3.
| Maximum | 939.2 |
| Decile 9 | 578.7 |
| Decile 8 | 537.7 |
| Decile 7 | 509.9 |
| Decile 6 | 486.6 |
| Median | 465.3 |
| Decile 4 | 444.3 |
| Decile 3 | 422.7 |
| Decile 2 | 398 |
| Decile 1 | 365.3 |
| Minimum | 42.9 |
|
|
- Mean = 469.344
- Std.dev = 84.2468
- 49 items above graph maximum of 792.1
|
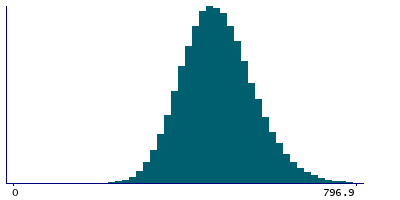
2 Instances
Instance 2 : Imaging visit (2014+)
83,241 participants, 83,241 items
| Maximum | 939.2 |
| Decile 9 | 578.3 |
| Decile 8 | 537.2 |
| Decile 7 | 509.4 |
| Decile 6 | 486.05 |
| Median | 464.7 |
| Decile 4 | 443.7 |
| Decile 3 | 422.2 |
| Decile 2 | 397.45 |
| Decile 1 | 364.8 |
| Minimum | 42.9 |
|

|
- Mean = 468.822
- Std.dev = 84.28
- 48 items above graph maximum of 791.8
|
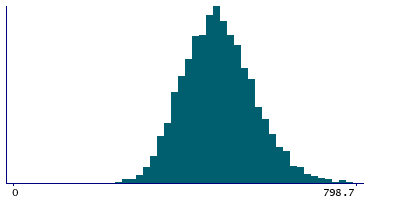
Instance 3 : First repeat imaging visit (2019+)
4,755 participants, 4,755 items
| Maximum | 817.3 |
| Decile 9 | 587 |
| Decile 8 | 546.4 |
| Decile 7 | 518.25 |
| Decile 6 | 495.2 |
| Median | 474.5 |
| Decile 4 | 454.9 |
| Decile 3 | 431.6 |
| Decile 2 | 407.2 |
| Decile 1 | 375.4 |
| Minimum | 143.4 |
|
|
- Mean = 478.484
- Std.dev = 83.1345
- 1 item above graph maximum of 798.6
|
Notes
Volume of Accumbens-area in the right hemisphere generated by subcortical volumetric segmentation (aseg)
0 Related Data-Fields
There are no related data-fields
0 Resources
There are no matching Resources
