Data
87,996 items of data are available, covering 83,313 participants.
Defined-instances run from 2 to 3, labelled using Instancing
2.
Units of measurement are mm3.
| Maximum | 933.482 |
| Decile 9 | 499.214 |
| Decile 8 | 473.059 |
| Decile 7 | 455.153 |
| Decile 6 | 440.273 |
| Median | 426.605 |
| Decile 4 | 413.577 |
| Decile 3 | 399.626 |
| Decile 2 | 383.822 |
| Decile 1 | 361.809 |
| Minimum | 96.8218 |
|
|
- Mean = 428.803
- Std.dev = 54.6274
- 9 items below graph minimum of 224.405
- 46 items above graph maximum of 636.618
|
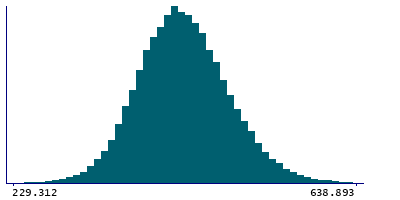
2 Instances
Instance 2 : Imaging visit (2014+)
83,241 participants, 83,241 items
| Maximum | 933.482 |
| Decile 9 | 498.944 |
| Decile 8 | 472.826 |
| Decile 7 | 454.86 |
| Decile 6 | 439.897 |
| Median | 426.186 |
| Decile 4 | 413.198 |
| Decile 3 | 399.202 |
| Decile 2 | 383.368 |
| Decile 1 | 361.437 |
| Minimum | 96.8218 |
|

|
- Mean = 428.446
- Std.dev = 54.6975
- 8 items below graph minimum of 223.93
- 44 items above graph maximum of 636.452
|
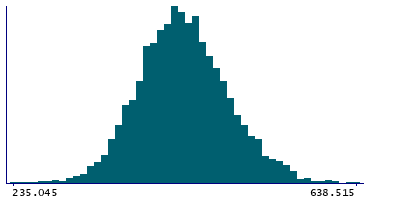
Instance 3 : First repeat imaging visit (2019+)
4,755 participants, 4,755 items
| Maximum | 644.093 |
| Decile 9 | 504.025 |
| Decile 8 | 477.954 |
| Decile 7 | 459.989 |
| Decile 6 | 446.046 |
| Median | 432.951 |
| Decile 4 | 420.75 |
| Decile 3 | 406.998 |
| Decile 2 | 391.398 |
| Decile 1 | 369.535 |
| Minimum | 203.501 |
|
|
- Mean = 435.044
- Std.dev = 52.9982
- 3 items below graph minimum of 235.045
- 2 items above graph maximum of 638.515
|
Notes
Volume of Basal-nucleus in the right hemisphere generated by subcortical volumetric sub-segmentation of the Amygdala Nuclei
0 Related Data-Fields
There are no related data-fields
0 Resources
There are no matching Resources
