Data
87,996 items of data are available, covering 83,313 participants.
Defined-instances run from 2 to 3, labelled using Instancing
2.
Units of measurement are mm3.
| Maximum | 134.94 |
| Decile 9 | 62.383 |
| Decile 8 | 58.4101 |
| Decile 7 | 55.6246 |
| Decile 6 | 53.3892 |
| Median | 51.3766 |
| Decile 4 | 49.4269 |
| Decile 3 | 47.3968 |
| Decile 2 | 45.1573 |
| Decile 1 | 42.0398 |
| Minimum | 13.8162 |
|
|
- Mean = 51.8733
- Std.dev = 8.08275
- 6 items below graph minimum of 21.6966
- 91 items above graph maximum of 82.7262
|
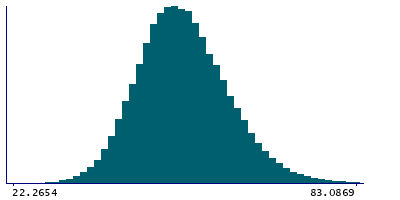
2 Instances
Instance 2 : Imaging visit (2014+)
83,241 participants, 83,241 items
| Maximum | 134.94 |
| Decile 9 | 62.3336 |
| Decile 8 | 58.3717 |
| Decile 7 | 55.5854 |
| Decile 6 | 53.3543 |
| Median | 51.3323 |
| Decile 4 | 49.3795 |
| Decile 3 | 47.3542 |
| Decile 2 | 45.1143 |
| Decile 1 | 41.9878 |
| Minimum | 13.8162 |
|

|
- Mean = 51.8295
- Std.dev = 8.08686
- 5 items below graph minimum of 21.6419
- 89 items above graph maximum of 82.6794
|
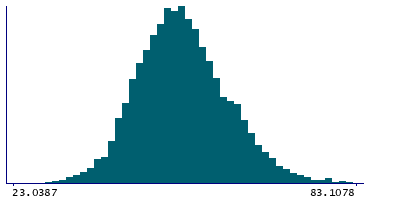
Instance 3 : First repeat imaging visit (2019+)
4,755 participants, 4,755 items
| Maximum | 94.013 |
| Decile 9 | 63.0847 |
| Decile 8 | 59.0638 |
| Decile 7 | 56.2293 |
| Decile 6 | 54.0745 |
| Median | 52.1445 |
| Decile 4 | 50.2311 |
| Decile 3 | 48.2729 |
| Decile 2 | 45.9531 |
| Decile 1 | 43.0617 |
| Minimum | 18.6404 |
|
|
- Mean = 52.6404
- Std.dev = 7.97152
- 1 item below graph minimum of 23.0387
- 4 items above graph maximum of 83.1078
|
Notes
Volume of Anterior-amygdaloid-area-AAA in the right hemisphere generated by subcortical volumetric sub-segmentation of the Amygdala Nuclei
0 Related Data-Fields
There are no related data-fields
0 Resources
There are no matching Resources
