Data
87,996 items of data are available, covering 83,313 participants.
Defined-instances run from 2 to 3, labelled using Instancing
2.
Units of measurement are mm3.
| Maximum | 1305.88 |
| Decile 9 | 656.199 |
| Decile 8 | 622.374 |
| Decile 7 | 598.377 |
| Decile 6 | 578.433 |
| Median | 560.089 |
| Decile 4 | 542.345 |
| Decile 3 | 523.385 |
| Decile 2 | 501.809 |
| Decile 1 | 471.635 |
| Minimum | 124.316 |
|
|
- Mean = 562.435
- Std.dev = 73.7022
- 41 items below graph minimum of 287.072
- 54 items above graph maximum of 840.762
|
2 Instances
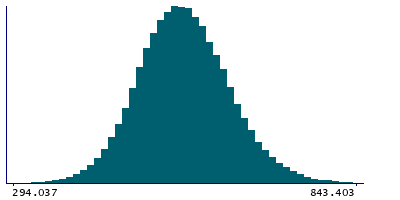
Instance 2 : Imaging visit (2014+)
83,241 participants, 83,241 items
| Maximum | 1305.88 |
| Decile 9 | 655.8 |
| Decile 8 | 621.877 |
| Decile 7 | 598.007 |
| Decile 6 | 578.031 |
| Median | 559.62 |
| Decile 4 | 541.911 |
| Decile 3 | 522.976 |
| Decile 2 | 501.359 |
| Decile 1 | 471.106 |
| Minimum | 140.713 |
|
|
- Mean = 562.002
- Std.dev = 73.7025
- 38 items below graph minimum of 286.411
- 50 items above graph maximum of 840.495
|
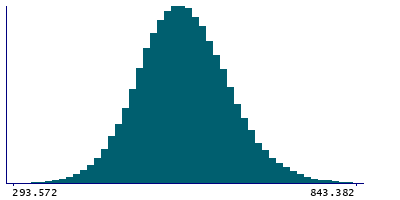
Instance 3 : First repeat imaging visit (2019+)
4,755 participants, 4,755 items
| Maximum | 1025.07 |
| Decile 9 | 663.389 |
| Decile 8 | 630.019 |
| Decile 7 | 605.638 |
| Decile 6 | 586.227 |
| Median | 568.16 |
| Decile 4 | 549.958 |
| Decile 3 | 531.036 |
| Decile 2 | 509.585 |
| Decile 1 | 481.532 |
| Minimum | 124.316 |
|

|
- Mean = 570.028
- Std.dev = 73.2829
- 3 items below graph minimum of 299.676
- 4 items above graph maximum of 845.245
|
Notes
Volume of Hippocampal-tail in the left hemisphere generated by subcortical volumetric sub-segmentation of the Hippocampal Subfields
0 Related Data-Fields
There are no related data-fields
0 Resources
There are no matching Resources
