Data
87,996 items of data are available, covering 83,313 participants.
Defined-instances run from 2 to 3, labelled using Instancing
2.
Units of measurement are mm3.
| Maximum | 403.369 |
| Decile 9 | 192.351 |
| Decile 8 | 182.478 |
| Decile 7 | 175.515 |
| Decile 6 | 169.713 |
| Median | 164.377 |
| Decile 4 | 159.083 |
| Decile 3 | 153.509 |
| Decile 2 | 147.026 |
| Decile 1 | 138.09 |
| Minimum | 38.6554 |
|
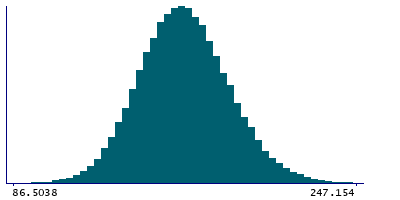
|
- Mean = 164.863
- Std.dev = 21.4675
- 23 items below graph minimum of 83.8294
- 31 items above graph maximum of 246.611
|
2 Instances
Instance 2 : Imaging visit (2014+)
83,241 participants, 83,241 items
| Maximum | 403.369 |
| Decile 9 | 192.2 |
| Decile 8 | 182.333 |
| Decile 7 | 175.343 |
| Decile 6 | 169.537 |
| Median | 164.178 |
| Decile 4 | 158.85 |
| Decile 3 | 153.287 |
| Decile 2 | 146.827 |
| Decile 1 | 137.864 |
| Minimum | 38.6554 |
|
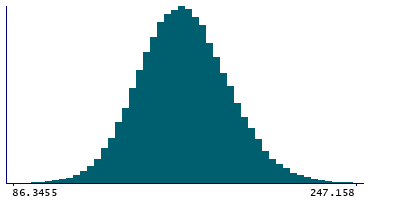
|
- Mean = 164.677
- Std.dev = 21.4923
- 21 items below graph minimum of 83.5276
- 29 items above graph maximum of 246.537
|
Instance 3 : First repeat imaging visit (2019+)
4,755 participants, 4,755 items
| Maximum | 252.316 |
| Decile 9 | 194.711 |
| Decile 8 | 185.293 |
| Decile 7 | 178.528 |
| Decile 6 | 172.784 |
| Median | 167.688 |
| Decile 4 | 162.289 |
| Decile 3 | 157.418 |
| Decile 2 | 150.671 |
| Decile 1 | 141.721 |
| Minimum | 81.9954 |
|
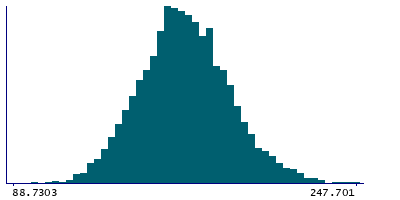
|
- Mean = 168.118
- Std.dev = 20.7604
- 1 item below graph minimum of 88.7303
- 1 item above graph maximum of 247.701
|
Notes
Volume of GC-ML-DG-body in the right hemisphere generated by subcortical volumetric sub-segmentation of the Hippocampal Subfields
0 Related Data-Fields
There are no related data-fields
0 Resources
There are no matching Resources
