Data
87,996 items of data are available, covering 83,313 participants.
Defined-instances run from 2 to 3, labelled using Instancing
2.
Units of measurement are mm3.
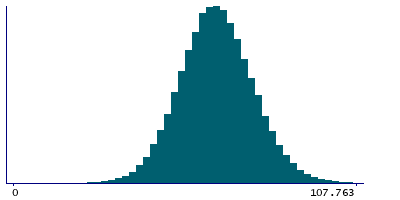
| Maximum | 147.597 |
| Decile 9 | 78.0171 |
| Decile 8 | 72.7561 |
| Decile 7 | 69.0474 |
| Decile 6 | 65.9101 |
| Median | 63.021 |
| Decile 4 | 60.1617 |
| Decile 3 | 57.1447 |
| Decile 2 | 53.5412 |
| Decile 1 | 48.5302 |
| Minimum | 8.02584 |
|
|
- Mean = 63.1852
- Std.dev = 11.6901
- 32 items above graph maximum of 107.504
|
2 Instances
Instance 2 : Imaging visit (2014+)
83,241 participants, 83,241 items
| Maximum | 147.597 |
| Decile 9 | 77.9633 |
| Decile 8 | 72.6612 |
| Decile 7 | 68.9546 |
| Decile 6 | 65.8068 |
| Median | 62.9346 |
| Decile 4 | 60.0785 |
| Decile 3 | 57.0681 |
| Decile 2 | 53.4564 |
| Decile 1 | 48.4704 |
| Minimum | 8.02584 |
|

|
- Mean = 63.1061
- Std.dev = 11.6863
- 30 items above graph maximum of 107.456
|
Instance 3 : First repeat imaging visit (2019+)
4,755 participants, 4,755 items
| Maximum | 111.011 |
| Decile 9 | 79.1193 |
| Decile 8 | 74.0981 |
| Decile 7 | 70.4957 |
| Decile 6 | 67.6695 |
| Median | 64.7259 |
| Decile 4 | 61.7105 |
| Decile 3 | 58.5962 |
| Decile 2 | 55.1509 |
| Decile 1 | 49.8762 |
| Minimum | 18.0858 |
|

|
- Mean = 64.57
- Std.dev = 11.671
- 1 item above graph maximum of 108.362
|
Notes
Volume of HATA in the right hemisphere generated by subcortical volumetric sub-segmentation of the Hippocampal Subfields
0 Related Data-Fields
There are no related data-fields
0 Resources
There are no matching Resources
