Data
87,996 items of data are available, covering 83,313 participants.
Defined-instances run from 2 to 3, labelled using Instancing
2.
Units of measurement are mm3.
| Maximum | 446.975 |
| Decile 9 | 224.151 |
| Decile 8 | 213.771 |
| Decile 7 | 206.495 |
| Decile 6 | 200.43 |
| Median | 194.848 |
| Decile 4 | 189.42 |
| Decile 3 | 183.765 |
| Decile 2 | 177.406 |
| Decile 1 | 168.908 |
| Minimum | 88.7078 |
|

|
- Mean = 195.925
- Std.dev = 22.0279
- 9 items below graph minimum of 113.666
- 101 items above graph maximum of 279.393
|
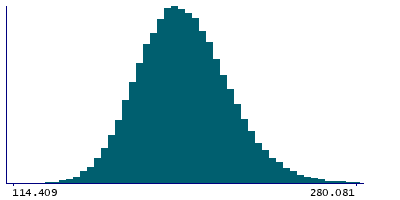
2 Instances
Instance 2 : Imaging visit (2014+)
83,241 participants, 83,241 items
| Maximum | 446.975 |
| Decile 9 | 224.12 |
| Decile 8 | 213.668 |
| Decile 7 | 206.407 |
| Decile 6 | 200.324 |
| Median | 194.741 |
| Decile 4 | 189.316 |
| Decile 3 | 183.669 |
| Decile 2 | 177.302 |
| Decile 1 | 168.802 |
| Minimum | 88.7078 |
|
|
- Mean = 195.834
- Std.dev = 22.0327
- 9 items below graph minimum of 113.485
- 94 items above graph maximum of 279.437
|
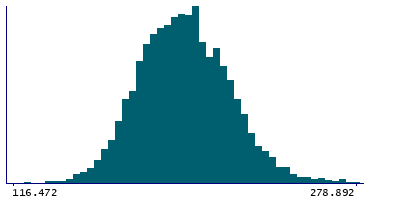
Instance 3 : First repeat imaging visit (2019+)
4,755 participants, 4,755 items
| Maximum | 395.929 |
| Decile 9 | 224.743 |
| Decile 8 | 215.253 |
| Decile 7 | 208.119 |
| Decile 6 | 202.091 |
| Median | 196.68 |
| Decile 4 | 191.174 |
| Decile 3 | 185.341 |
| Decile 2 | 178.975 |
| Decile 1 | 170.612 |
| Minimum | 116.269 |
|
|
- Mean = 197.51
- Std.dev = 21.8838
- 1 item below graph minimum of 116.48
- 9 items above graph maximum of 278.875
|
Notes
Volume of PuA in the left hemisphere generated by subcortical volumetric sub-segmentation of the Thalamic Nuclei
0 Related Data-Fields
There are no related data-fields
0 Resources
There are no matching Resources
