Data
87,996 items of data are available, covering 83,313 participants.
Defined-instances run from 2 to 3, labelled using Instancing
2.
Units of measurement are mm3.
| Maximum | 110.662 |
| Decile 9 | 68.0144 |
| Decile 8 | 63.9742 |
| Decile 7 | 61.2074 |
| Decile 6 | 58.9918 |
| Median | 57.0022 |
| Decile 4 | 55.07 |
| Decile 3 | 53.0703 |
| Decile 2 | 50.8048 |
| Decile 1 | 47.8733 |
| Minimum | 19.0892 |
|
|
- Mean = 57.5599
- Std.dev = 8.01513
- 14 items below graph minimum of 27.7321
- 102 items above graph maximum of 88.1555
|
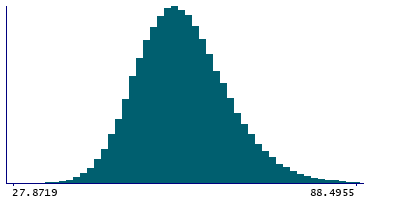
2 Instances
Instance 2 : Imaging visit (2014+)
83,241 participants, 83,241 items
| Maximum | 110.662 |
| Decile 9 | 67.9994 |
| Decile 8 | 63.9535 |
| Decile 7 | 61.1791 |
| Decile 6 | 58.9617 |
| Median | 56.9611 |
| Decile 4 | 55.0317 |
| Decile 3 | 53.0395 |
| Decile 2 | 50.7732 |
| Decile 1 | 47.8475 |
| Minimum | 19.0892 |
|

|
- Mean = 57.5337
- Std.dev = 8.02054
- 14 items below graph minimum of 27.6957
- 98 items above graph maximum of 88.1512
|
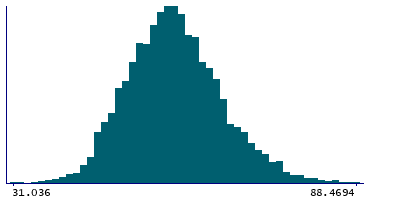
Instance 3 : First repeat imaging visit (2019+)
4,755 participants, 4,755 items
| Maximum | 99.7445 |
| Decile 9 | 68.3788 |
| Decile 8 | 64.3577 |
| Decile 7 | 61.6592 |
| Decile 6 | 59.4579 |
| Median | 57.5681 |
| Decile 4 | 55.7549 |
| Decile 3 | 53.7624 |
| Decile 2 | 51.3978 |
| Decile 1 | 48.2882 |
| Minimum | 31.036 |
|
|
- Mean = 58.0178
- Std.dev = 7.90572
- 4 items above graph maximum of 88.4694
|
Notes
Volume of Pf in the right hemisphere generated by subcortical volumetric sub-segmentation of the Thalamic Nuclei
0 Related Data-Fields
There are no related data-fields
0 Resources
There are no matching Resources
