Data
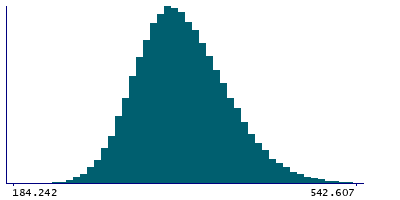
87,996 items of data are available, covering 83,313 participants.
Defined-instances run from 2 to 3, labelled using Instancing
2.
Units of measurement are mm3.
| Maximum | 1101.91 |
| Decile 9 | 421.971 |
| Decile 8 | 398.342 |
| Decile 7 | 381.879 |
| Decile 6 | 368.412 |
| Median | 356.355 |
| Decile 4 | 344.893 |
| Decile 3 | 333.068 |
| Decile 2 | 319.873 |
| Decile 1 | 302.594 |
| Minimum | 150.884 |
|
|
- Mean = 359.909
- Std.dev = 47.2433
- 4 items below graph minimum of 183.217
- 81 items above graph maximum of 541.348
|
2 Instances
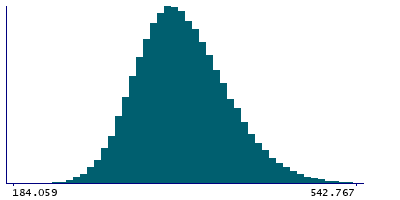
Instance 2 : Imaging visit (2014+)
83,241 participants, 83,241 items
| Maximum | 1101.91 |
| Decile 9 | 421.915 |
| Decile 8 | 398.211 |
| Decile 7 | 381.758 |
| Decile 6 | 368.312 |
| Median | 356.245 |
| Decile 4 | 344.769 |
| Decile 3 | 332.908 |
| Decile 2 | 319.75 |
| Decile 1 | 302.477 |
| Minimum | 150.884 |
|
|
- Mean = 359.796
- Std.dev = 47.257
- 4 items below graph minimum of 183.039
- 77 items above graph maximum of 541.353
|
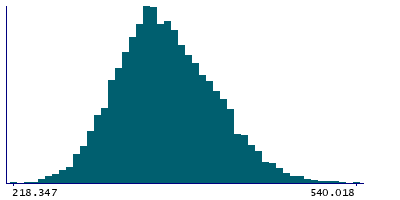
Instance 3 : First repeat imaging visit (2019+)
4,755 participants, 4,755 items
| Maximum | 828.199 |
| Decile 9 | 422.639 |
| Decile 8 | 401.1 |
| Decile 7 | 384.219 |
| Decile 6 | 370.315 |
| Median | 358.213 |
| Decile 4 | 346.895 |
| Decile 3 | 335.995 |
| Decile 2 | 322.829 |
| Decile 1 | 305.26 |
| Minimum | 218.347 |
|
|
- Mean = 361.903
- Std.dev = 46.9574
- 4 items above graph maximum of 540.018
|
Notes
Volume of VA in the right hemisphere generated by subcortical volumetric sub-segmentation of the Thalamic Nuclei
0 Related Data-Fields
There are no related data-fields
0 Resources
There are no matching Resources
