Data
87,996 items of data are available, covering 83,313 participants.
Defined-instances run from 2 to 3, labelled using Instancing
2.
Units of measurement are mm.
| Maximum | 3.377 |
| Decile 9 | 2.863 |
| Decile 8 | 2.784 |
| Decile 7 | 2.725 |
| Decile 6 | 2.671 |
| Median | 2.619 |
| Decile 4 | 2.566 |
| Decile 3 | 2.506 |
| Decile 2 | 2.432 |
| Decile 1 | 2.327 |
| Minimum | 1.539 |
|
|
- Mean = 2.60531
- Std.dev = 0.211124
- 41 items below graph minimum of 1.791
|
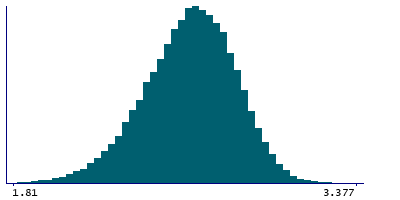
2 Instances
Instance 2 : Imaging visit (2014+)
83,241 participants, 83,241 items
| Maximum | 3.377 |
| Decile 9 | 2.863 |
| Decile 8 | 2.783 |
| Decile 7 | 2.724 |
| Decile 6 | 2.67 |
| Median | 2.619 |
| Decile 4 | 2.565 |
| Decile 3 | 2.505 |
| Decile 2 | 2.431 |
| Decile 1 | 2.326 |
| Minimum | 1.539 |
|

|
- Mean = 2.6046
- Std.dev = 0.211309
- 38 items below graph minimum of 1.789
|
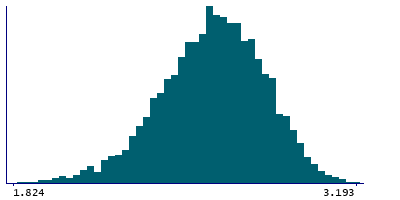
Instance 3 : First repeat imaging visit (2019+)
4,755 participants, 4,755 items
| Maximum | 3.193 |
| Decile 9 | 2.871 |
| Decile 8 | 2.794 |
| Decile 7 | 2.734 |
| Decile 6 | 2.68 |
| Median | 2.629 |
| Decile 4 | 2.579 |
| Decile 3 | 2.519 |
| Decile 2 | 2.447 |
| Decile 1 | 2.3475 |
| Minimum | 1.658 |
|
|
- Mean = 2.61774
- Std.dev = 0.207464
- 3 items below graph minimum of 1.824
|
Notes
Mean thickness of paracentral in the left hemisphere generated by parcellation of the white surface using Desikan-Killiany parcellation
0 Related Data-Fields
There are no related data-fields
0 Resources
There are no matching Resources
