Data
87,996 items of data are available, covering 83,313 participants.
Defined-instances run from 2 to 3, labelled using Instancing
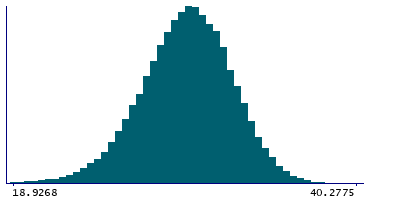
2.
Units of measurement are AU.
| Maximum | 40.4442 |
| Decile 9 | 33.1479 |
| Decile 8 | 32.0007 |
| Decile 7 | 31.1705 |
| Decile 6 | 30.4254 |
| Median | 29.7251 |
| Decile 4 | 29.0026 |
| Decile 3 | 28.2084 |
| Decile 2 | 27.2465 |
| Decile 1 | 25.8523 |
| Minimum | 5.6661 |
|

|
- Mean = 29.5768
- Std.dev = 2.90595
- 124 items below graph minimum of 18.5567
- 1 item above graph maximum of 40.4436
|
2 Instances
Instance 2 : Imaging visit (2014+)
83,241 participants, 83,241 items
| Maximum | 40.4442 |
| Decile 9 | 33.1293 |
| Decile 8 | 31.9841 |
| Decile 7 | 31.1513 |
| Decile 6 | 30.4027 |
| Median | 29.703 |
| Decile 4 | 28.9809 |
| Decile 3 | 28.1844 |
| Decile 2 | 27.2278 |
| Decile 1 | 25.8267 |
| Minimum | 10.626 |
|
|
- Mean = 29.5565
- Std.dev = 2.90503
- 114 items below graph minimum of 18.5242
- 1 item above graph maximum of 40.4319
|
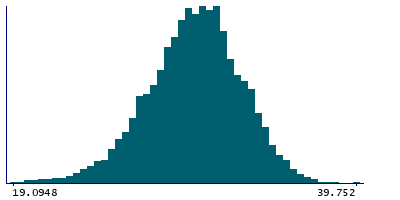
Instance 3 : First repeat imaging visit (2019+)
4,755 participants, 4,755 items
| Maximum | 39.752 |
| Decile 9 | 33.472 |
| Decile 8 | 32.3155 |
| Decile 7 | 31.4658 |
| Decile 6 | 30.7904 |
| Median | 30.0944 |
| Decile 4 | 29.3905 |
| Decile 3 | 28.6221 |
| Decile 2 | 27.6493 |
| Decile 1 | 26.2834 |
| Minimum | 5.6661 |
|
|
- Mean = 29.9313
- Std.dev = 2.89929
- 8 items below graph minimum of 19.0948
|
Notes
Grey-white contrast in temporalpole in the left hemisphere calculated as a percentage of the mean gray-white matter intensity from Desikan-Killiany parcellation
0 Related Data-Fields
There are no related data-fields
0 Resources
There are no matching Resources
