Data
87,996 items of data are available, covering 83,313 participants.
Defined-instances run from 2 to 3, labelled using Instancing
2.
Units of measurement are mm2.
| Maximum | 4771 |
| Decile 9 | 3241 |
| Decile 8 | 3024 |
| Decile 7 | 2878 |
| Decile 6 | 2757 |
| Median | 2650 |
| Decile 4 | 2547 |
| Decile 3 | 2442 |
| Decile 2 | 2327 |
| Decile 1 | 2177 |
| Minimum | 1227 |
|

|
- Mean = 2683.72
- Std.dev = 416.232
- 36 items above graph maximum of 4305
|
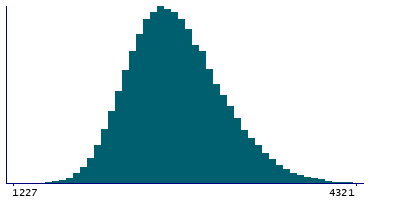
2 Instances
Instance 2 : Imaging visit (2014+)
83,241 participants, 83,241 items
| Maximum | 4771 |
| Decile 9 | 3241 |
| Decile 8 | 3023 |
| Decile 7 | 2877 |
| Decile 6 | 2756 |
| Median | 2648 |
| Decile 4 | 2545 |
| Decile 3 | 2441 |
| Decile 2 | 2326 |
| Decile 1 | 2176 |
| Minimum | 1227 |
|
|
- Mean = 2682.6
- Std.dev = 416.515
- 35 items above graph maximum of 4306
|
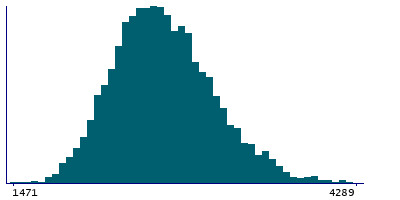
Instance 3 : First repeat imaging visit (2019+)
4,755 participants, 4,755 items
| Maximum | 4471 |
| Decile 9 | 3244 |
| Decile 8 | 3044 |
| Decile 7 | 2895 |
| Decile 6 | 2779 |
| Median | 2673 |
| Decile 4 | 2571 |
| Decile 3 | 2464 |
| Decile 2 | 2354 |
| Decile 1 | 2199 |
| Minimum | 1471 |
|
|
- Mean = 2703.39
- Std.dev = 410.739
- 2 items above graph maximum of 4289
|
Notes
Area of V1 in the right hemisphere generated by parcellation of the white surface using BA_exvivo parcellation
0 Related Data-Fields
There are no related data-fields
0 Resources
There are no matching Resources
