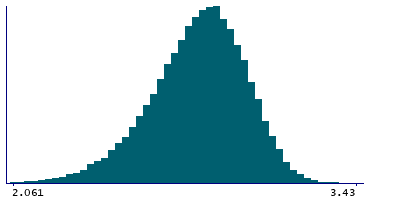
Data
87,996 items of data are available, covering 83,313 participants.
Defined-instances run from 2 to 3, labelled using Instancing
2.
Units of measurement are mm.
| Maximum | 3.446 |
| Decile 9 | 3.017 |
| Decile 8 | 2.949 |
| Decile 7 | 2.896 |
| Decile 6 | 2.85 |
| Median | 2.803 |
| Decile 4 | 2.755 |
| Decile 3 | 2.699 |
| Decile 2 | 2.63 |
| Decile 1 | 2.527 |
| Minimum | 1.458 |
|
|
- Mean = 2.78476
- Std.dev = 0.194314
- 85 items below graph minimum of 2.037
|
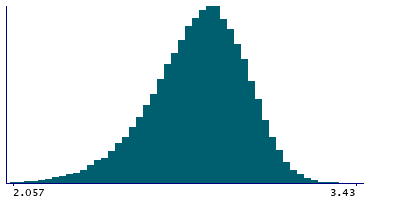
2 Instances
Instance 2 : Imaging visit (2014+)
83,241 participants, 83,241 items
| Maximum | 3.446 |
| Decile 9 | 3.016 |
| Decile 8 | 2.948 |
| Decile 7 | 2.895 |
| Decile 6 | 2.848 |
| Median | 2.802 |
| Decile 4 | 2.753 |
| Decile 3 | 2.697 |
| Decile 2 | 2.628 |
| Decile 1 | 2.525 |
| Minimum | 1.659 |
|
|
- Mean = 2.78328
- Std.dev = 0.194663
- 75 items below graph minimum of 2.034
|
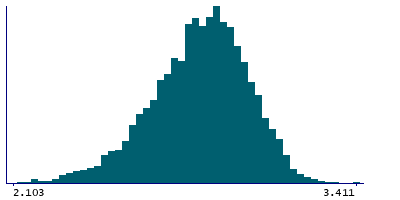
Instance 3 : First repeat imaging visit (2019+)
4,755 participants, 4,755 items
| Maximum | 3.411 |
| Decile 9 | 3.035 |
| Decile 8 | 2.966 |
| Decile 7 | 2.917 |
| Decile 6 | 2.872 |
| Median | 2.827 |
| Decile 4 | 2.782 |
| Decile 3 | 2.727 |
| Decile 2 | 2.664 |
| Decile 1 | 2.569 |
| Minimum | 1.458 |
|
|
- Mean = 2.81069
- Std.dev = 0.186203
- 7 items below graph minimum of 2.103
|
Notes
Mean thickness of precentral in the left hemisphere generated by parcellation of the white surface using DKT parcellation
0 Related Data-Fields
There are no related data-fields
0 Resources
There are no matching Resources
