Data
87,996 items of data are available, covering 83,313 participants.
Defined-instances run from 2 to 3, labelled using Instancing
2.
Units of measurement are mm2.
| Maximum | 3401 |
| Decile 9 | 2332 |
| Decile 8 | 2200 |
| Decile 7 | 2108 |
| Decile 6 | 2034 |
| Median | 1967 |
| Decile 4 | 1902 |
| Decile 3 | 1835 |
| Decile 2 | 1758 |
| Decile 1 | 1658 |
| Minimum | 683 |
|

|
- Mean = 1983.13
- Std.dev = 264.999
- 11 items below graph minimum of 984
- 47 items above graph maximum of 3006
|
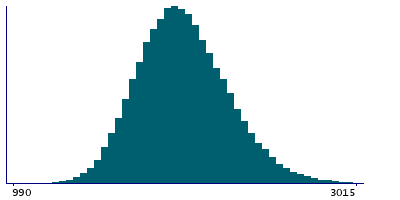
2 Instances
Instance 2 : Imaging visit (2014+)
83,241 participants, 83,241 items
| Maximum | 3401 |
| Decile 9 | 2331 |
| Decile 8 | 2200 |
| Decile 7 | 2108 |
| Decile 6 | 2033 |
| Median | 1966 |
| Decile 4 | 1901 |
| Decile 3 | 1833 |
| Decile 2 | 1757 |
| Decile 1 | 1657 |
| Minimum | 683 |
|
|
- Mean = 1982.29
- Std.dev = 265.072
- 10 items below graph minimum of 983
- 46 items above graph maximum of 3005
|
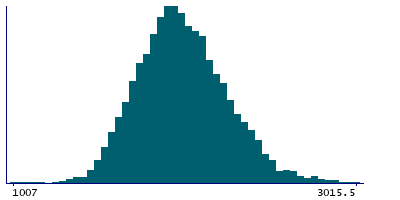
Instance 3 : First repeat imaging visit (2019+)
4,755 participants, 4,755 items
| Maximum | 3156 |
| Decile 9 | 2346 |
| Decile 8 | 2214 |
| Decile 7 | 2121 |
| Decile 6 | 2047 |
| Median | 1980 |
| Decile 4 | 1918 |
| Decile 3 | 1852 |
| Decile 2 | 1774 |
| Decile 1 | 1676.5 |
| Minimum | 944 |
|
|
- Mean = 1997.85
- Std.dev = 263.289
- 1 item below graph minimum of 1007
- 1 item above graph maximum of 3015.5
|
Notes
Area of cuneus in the right hemisphere generated by parcellation of the white surface using DKT parcellation
0 Related Data-Fields
There are no related data-fields
0 Resources
There are no matching Resources
