Data
87,996 items of data are available, covering 83,313 participants.
Defined-instances run from 2 to 3, labelled using Instancing
2.
Units of measurement are mm2.
| Maximum | 2914 |
| Decile 9 | 1880 |
| Decile 8 | 1743 |
| Decile 7 | 1651 |
| Decile 6 | 1575 |
| Median | 1507 |
| Decile 4 | 1443 |
| Decile 3 | 1377 |
| Decile 2 | 1303 |
| Decile 1 | 1211 |
| Minimum | 592 |
|
|
- Mean = 1528.85
- Std.dev = 261.635
- 47 items above graph maximum of 2549
|
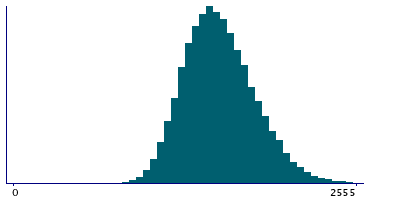
2 Instances
Instance 2 : Imaging visit (2014+)
83,241 participants, 83,241 items
| Maximum | 2914 |
| Decile 9 | 1879 |
| Decile 8 | 1743 |
| Decile 7 | 1650 |
| Decile 6 | 1574 |
| Median | 1507 |
| Decile 4 | 1442 |
| Decile 3 | 1376 |
| Decile 2 | 1302 |
| Decile 1 | 1210 |
| Minimum | 592 |
|

|
- Mean = 1528.26
- Std.dev = 261.754
- 44 items above graph maximum of 2548
|
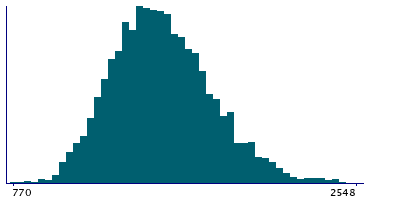
Instance 3 : First repeat imaging visit (2019+)
4,755 participants, 4,755 items
| Maximum | 2703 |
| Decile 9 | 1884.5 |
| Decile 8 | 1750 |
| Decile 7 | 1662 |
| Decile 6 | 1585 |
| Median | 1520.5 |
| Decile 4 | 1455 |
| Decile 3 | 1391 |
| Decile 2 | 1318 |
| Decile 1 | 1221 |
| Minimum | 770 |
|
|
- Mean = 1539.17
- Std.dev = 259.32
- 3 items above graph maximum of 2548
|
Notes
Area of pericalcarine in the right hemisphere generated by parcellation of the white surface using DKT parcellation
0 Related Data-Fields
There are no related data-fields
0 Resources
There are no matching Resources
