Data
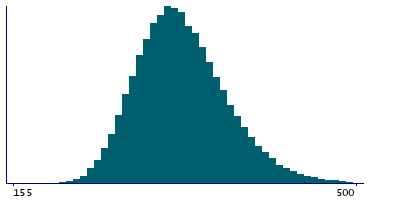
87,996 items of data are available, covering 83,313 participants.
Defined-instances run from 2 to 3, labelled using Instancing
2.
Units of measurement are mm2.
| Maximum | 580 |
| Decile 9 | 383 |
| Decile 8 | 359 |
| Decile 7 | 343 |
| Decile 6 | 331 |
| Median | 319 |
| Decile 4 | 309 |
| Decile 3 | 297 |
| Decile 2 | 285 |
| Decile 1 | 269 |
| Minimum | 97 |
|
|
- Mean = 323.368
- Std.dev = 45.4975
- 3 items below graph minimum of 155
- 124 items above graph maximum of 497
|
2 Instances
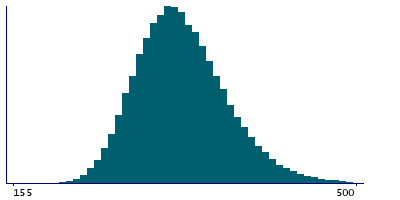
Instance 2 : Imaging visit (2014+)
83,241 participants, 83,241 items
| Maximum | 580 |
| Decile 9 | 383 |
| Decile 8 | 359 |
| Decile 7 | 343 |
| Decile 6 | 330 |
| Median | 319 |
| Decile 4 | 309 |
| Decile 3 | 297 |
| Decile 2 | 285 |
| Decile 1 | 269 |
| Minimum | 97 |
|
|
- Mean = 323.211
- Std.dev = 45.4347
- 3 items below graph minimum of 155
- 115 items above graph maximum of 497
|
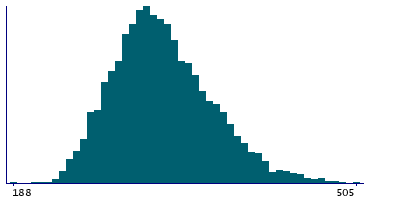
Instance 3 : First repeat imaging visit (2019+)
4,755 participants, 4,755 items
| Maximum | 578 |
| Decile 9 | 388 |
| Decile 8 | 364 |
| Decile 7 | 346 |
| Decile 6 | 333 |
| Median | 321 |
| Decile 4 | 310 |
| Decile 3 | 300 |
| Decile 2 | 287 |
| Decile 1 | 271 |
| Minimum | 188 |
|
|
- Mean = 326.119
- Std.dev = 46.4968
- 8 items above graph maximum of 505
|
Notes
Area of transversetemporal in the right hemisphere generated by parcellation of the white surface using DKT parcellation
0 Related Data-Fields
There are no related data-fields
0 Resources
There are no matching Resources
