Data
87,996 items of data are available, covering 83,313 participants.
Defined-instances run from 2 to 3, labelled using Instancing
2.
Units of measurement are mm.
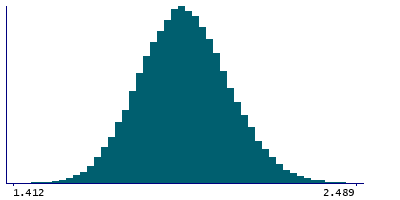
| Maximum | 2.843 |
| Decile 9 | 2.128 |
| Decile 8 | 2.064 |
| Decile 7 | 2.018 |
| Decile 6 | 1.98 |
| Median | 1.944 |
| Decile 4 | 1.909 |
| Decile 3 | 1.871 |
| Decile 2 | 1.828 |
| Decile 1 | 1.769 |
| Minimum | 1.4 |
|
|
- Mean = 1.94694
- Std.dev = 0.140467
- 2 items below graph minimum of 1.41
- 20 items above graph maximum of 2.487
|
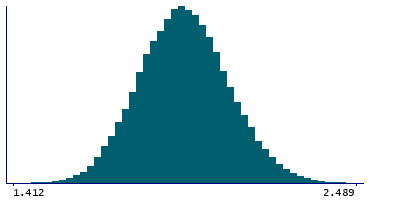
2 Instances
Instance 2 : Imaging visit (2014+)
83,241 participants, 83,241 items
| Maximum | 2.796 |
| Decile 9 | 2.128 |
| Decile 8 | 2.064 |
| Decile 7 | 2.018 |
| Decile 6 | 1.98 |
| Median | 1.944 |
| Decile 4 | 1.909 |
| Decile 3 | 1.871 |
| Decile 2 | 1.828 |
| Decile 1 | 1.769 |
| Minimum | 1.4 |
|
|
- Mean = 1.94685
- Std.dev = 0.140495
- 2 items below graph minimum of 1.41
- 18 items above graph maximum of 2.487
|
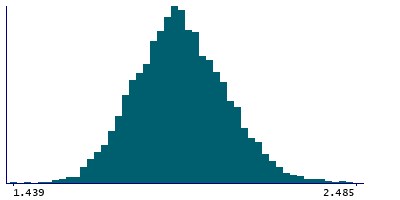
Instance 3 : First repeat imaging visit (2019+)
4,755 participants, 4,755 items
| Maximum | 2.843 |
| Decile 9 | 2.129 |
| Decile 8 | 2.065 |
| Decile 7 | 2.016 |
| Decile 6 | 1.978 |
| Median | 1.943 |
| Decile 4 | 1.911 |
| Decile 3 | 1.874 |
| Decile 2 | 1.83 |
| Decile 1 | 1.773 |
| Minimum | 1.439 |
|
|
- Mean = 1.94859
- Std.dev = 0.139973
- 2 items above graph maximum of 2.485
|
Notes
Mean thickness of cuneus in the right hemisphere generated by parcellation of the white surface using DKT parcellation
0 Related Data-Fields
There are no related data-fields
0 Resources
There are no matching Resources
