Data
87,996 items of data are available, covering 83,313 participants.
Defined-instances run from 2 to 3, labelled using Instancing
2.
Units of measurement are mm.
| Maximum | 3.006 |
| Decile 9 | 2.461 |
| Decile 8 | 2.397 |
| Decile 7 | 2.351 |
| Decile 6 | 2.311 |
| Median | 2.273 |
| Decile 4 | 2.233 |
| Decile 3 | 2.188 |
| Decile 2 | 2.135 |
| Decile 1 | 2.057 |
| Minimum | 1.349 |
|

|
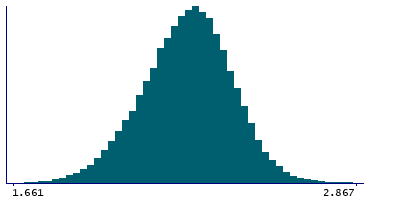
- Mean = 2.2657
- Std.dev = 0.159276
- 24 items below graph minimum of 1.653
- 25 items above graph maximum of 2.865
|
2 Instances
Instance 2 : Imaging visit (2014+)
83,241 participants, 83,241 items
| Maximum | 3.006 |
| Decile 9 | 2.46 |
| Decile 8 | 2.397 |
| Decile 7 | 2.351 |
| Decile 6 | 2.31 |
| Median | 2.272 |
| Decile 4 | 2.232 |
| Decile 3 | 2.188 |
| Decile 2 | 2.133 |
| Decile 1 | 2.055 |
| Minimum | 1.457 |
|
|
- Mean = 2.26479
- Std.dev = 0.159529
- 22 items below graph minimum of 1.65
- 23 items above graph maximum of 2.865
|
Instance 3 : First repeat imaging visit (2019+)
4,755 participants, 4,755 items
| Maximum | 2.869 |
| Decile 9 | 2.47 |
| Decile 8 | 2.409 |
| Decile 7 | 2.363 |
| Decile 6 | 2.324 |
| Median | 2.286 |
| Decile 4 | 2.248 |
| Decile 3 | 2.205 |
| Decile 2 | 2.157 |
| Decile 1 | 2.0895 |
| Minimum | 1.349 |
|

|
- Mean = 2.28161
- Std.dev = 0.153923
- 3 items below graph minimum of 1.709
- 5 items above graph maximum of 2.8505
|
Notes
Mean thickness of postcentral in the right hemisphere generated by parcellation of the white surface using DKT parcellation
0 Related Data-Fields
There are no related data-fields
0 Resources
There are no matching Resources
