Data
87,996 items of data are available, covering 83,313 participants.
Defined-instances run from 2 to 3, labelled using Instancing
2.
Units of measurement are mm.
| Maximum | 3.893 |
| Decile 9 | 2.835 |
| Decile 8 | 2.754 |
| Decile 7 | 2.698 |
| Decile 6 | 2.65 |
| Median | 2.607 |
| Decile 4 | 2.562 |
| Decile 3 | 2.513 |
| Decile 2 | 2.457 |
| Decile 1 | 2.378 |
| Minimum | 1.634 |
|

|
- Mean = 2.60607
- Std.dev = 0.182969
- 37 items below graph minimum of 1.921
- 59 items above graph maximum of 3.292
|
2 Instances
Instance 2 : Imaging visit (2014+)
83,241 participants, 83,241 items
| Maximum | 3.893 |
| Decile 9 | 2.835 |
| Decile 8 | 2.754 |
| Decile 7 | 2.697 |
| Decile 6 | 2.65 |
| Median | 2.606 |
| Decile 4 | 2.561 |
| Decile 3 | 2.512 |
| Decile 2 | 2.456 |
| Decile 1 | 2.377 |
| Minimum | 1.641 |
|

|
- Mean = 2.60542
- Std.dev = 0.183267
- 30 items below graph minimum of 1.919
- 57 items above graph maximum of 3.293
|
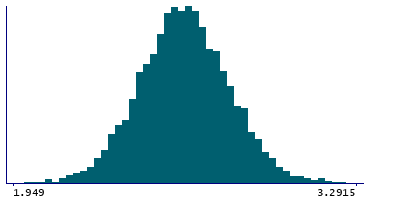
Instance 3 : First repeat imaging visit (2019+)
4,755 participants, 4,755 items
| Maximum | 3.438 |
| Decile 9 | 2.844 |
| Decile 8 | 2.762 |
| Decile 7 | 2.7045 |
| Decile 6 | 2.658 |
| Median | 2.616 |
| Decile 4 | 2.573 |
| Decile 3 | 2.529 |
| Decile 2 | 2.471 |
| Decile 1 | 2.3965 |
| Minimum | 1.634 |
|
|
- Mean = 2.6175
- Std.dev = 0.177278
- 2 items below graph minimum of 1.949
- 2 items above graph maximum of 3.2915
|
Notes
Mean thickness of G+S-frontomargin in the left hemisphere generated by parcellation of the white surface using Destrieux (a2009s) parcellation
0 Related Data-Fields
There are no related data-fields
0 Resources
There are no matching Resources
