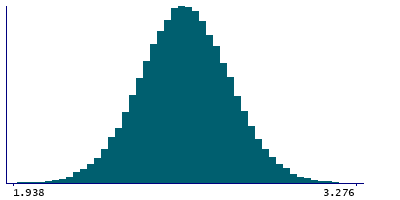
Data
87,996 items of data are available, covering 83,313 participants.
Defined-instances run from 2 to 3, labelled using Instancing
2.
Units of measurement are mm.
| Maximum | 3.43 |
| Decile 9 | 2.827 |
| Decile 8 | 2.75 |
| Decile 7 | 2.693 |
| Decile 6 | 2.646 |
| Median | 2.601 |
| Decile 4 | 2.557 |
| Decile 3 | 2.51 |
| Decile 2 | 2.455 |
| Decile 1 | 2.377 |
| Minimum | 1.38 |
|
|
- Mean = 2.60155
- Std.dev = 0.177424
- 29 items below graph minimum of 1.927
- 17 items above graph maximum of 3.277
|
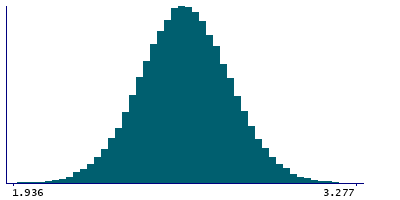
2 Instances
Instance 2 : Imaging visit (2014+)
83,241 participants, 83,241 items
| Maximum | 3.43 |
| Decile 9 | 2.828 |
| Decile 8 | 2.749 |
| Decile 7 | 2.693 |
| Decile 6 | 2.645 |
| Median | 2.6 |
| Decile 4 | 2.556 |
| Decile 3 | 2.509 |
| Decile 2 | 2.454 |
| Decile 1 | 2.376 |
| Minimum | 1.433 |
|
|
- Mean = 2.60096
- Std.dev = 0.177751
- 24 items below graph minimum of 1.924
- 14 items above graph maximum of 3.28
|
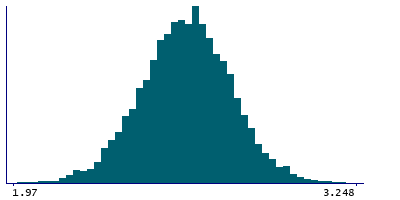
Instance 3 : First repeat imaging visit (2019+)
4,755 participants, 4,755 items
| Maximum | 3.329 |
| Decile 9 | 2.822 |
| Decile 8 | 2.754 |
| Decile 7 | 2.701 |
| Decile 6 | 2.656 |
| Median | 2.615 |
| Decile 4 | 2.572 |
| Decile 3 | 2.527 |
| Decile 2 | 2.474 |
| Decile 1 | 2.396 |
| Minimum | 1.38 |
|
|
- Mean = 2.61189
- Std.dev = 0.171269
- 6 items below graph minimum of 1.97
- 3 items above graph maximum of 3.248
|
Notes
Mean thickness of G+S-occipital-inf in the left hemisphere generated by parcellation of the white surface using Destrieux (a2009s) parcellation
0 Related Data-Fields
There are no related data-fields
0 Resources
There are no matching Resources
